PyGraphviz (几何图形可视化工具) 简单入门


数据科学/医学信息学/云吸猫爱好者
1 Graphviz 几何图形工具
Graphviz 是一个几何图形可视化软件,能够将数据的结构信息表示为抽象图形和网络图的方式。PyGraphviz 主要对数据量大、可任意定制的图形上具有强大优势。
建议:由于 PyGraphviz 暂时无法对同源节点合并线段。在流程图、小型结构图方面,Visio 可以作为 Graphviz 的直接替代软件。
2 获取模块
(1) Windows 系统
步骤一:到官网 Graphviz 官网下载 msi 文件,并将 Graphviz2.38\bin 添加到环境变量;
步骤二:终端输入pip install pygraphviz
部分读者反映 pip 无法安装正确的版本,可以到下面的网站中找到对应的py版本,离线安装:
https://github.com/CristiFati/Prebuilt-Binaries/tree/master/PyGraphviz/v1.5/Graphviz-2.42.2
(2) MacOS 系统
步骤一:在终端使用 Homebrew 下载: brew install graphviz
步骤二:终端输入pip install pygraphviz
3 快速入门
(1) 导入模块
import pygraphviz as pgv(2) 创建图形
G = pgv.AGraph(directed=True, strict=False, nodesep=0, ranksep=1.2, rankdir="TB",
               splines="none", concentrate=True, bgcolor="write",
compound=True, normalize=False, encoding='UTF-8')- directed -> False | True:有向图
- strict -> True | False:简单图
- nodesep:同级节点最小间距
- ranksep:不同级节点最小间距
- rankdir:绘图方向,可选 TB (从上到下), LR (从左到右), BT (从下到上), RL (从右到左)
- splines:线条类型,可选 ortho (直角), polyline (折线), spline (曲线), line (线条), none (无)
- concentrate -> True | False:合并线条 (双向箭头)
- bgcolor:背景颜色
- compound -> True | False:多子图时,不允许子图相互覆盖
- normalize -> False | True:以第一个节点作为顶节点
(3) 添加节点
G.add_node(name, label=None, fontname="Times-Roman", fontsize=14,
           shape="ellipse", style="rounded", color="black", fontcolor="black",
           pos="x,y(!)", fixedsize=False, width=1, height=1)

G.add_nodes_from(names, **attr) # 批量添加点,参数同上 - name -> str:节点名。label 为节点标签,未指定时显示 name
- fontname:字体名称,常用:Microsoft YaHei, SimHei, KaiTi, SimSun, FangSong, Times-Roman, Helvetica, Courier。可以使用 "times bold italic" 表示字体类型、粗细、倾斜
- fixedsize -> Flase | True | "shape"`:固定大小,默认随文本长度变化。设置为 True 时,width 和 height 参数共同控制点大小。设置为 "shape" 时,将取标签文本和设置值的较大者
- style:节点线样式,使用 `color` 设置线条颜色 (style="filled" 时,设置填充颜色)


- shape:节点形状
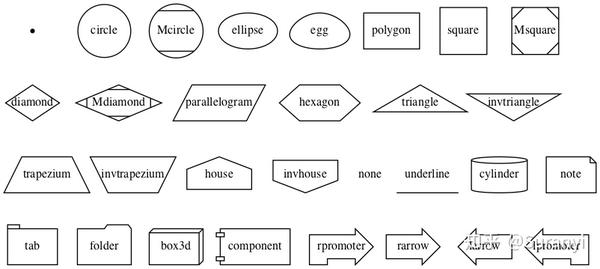
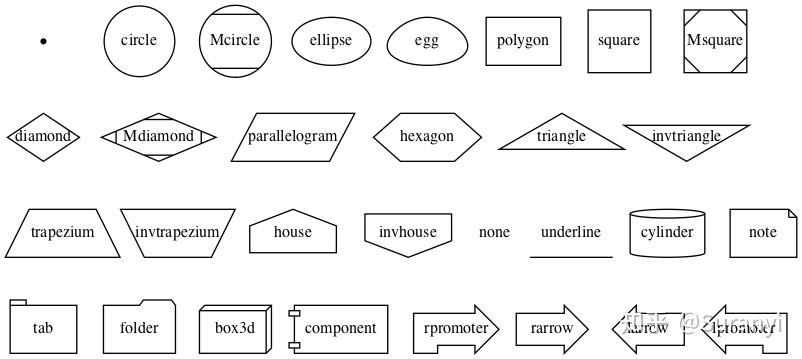
- pos -> str:点的初始位置。使用 "x,y!" 时,可以强制固定点的位置。
(4) 添加边
G.add_edge(origin, target, color="black", style="solid", penwidth=1,
           label="", fontname="Times-Roman", fontsize=14, fontcolor="black",
           arrowsize=1, arrowhead="normal", arrowtail="normal", dir="forward")

G.add_nodes_from([[origin_1, target_1],
[origin_2, target_2],...], **attr) # 批量添加线,参数同上- label -> str:边标签,未指定时不显示
- penwidth:线条粗细
- arrowsize:箭头大小
- arrowhead:箭头类型,可选 normal, vee
- dir:箭头方向,可选 both, forward, back, none。只有在无向图中才起作用!
(5) 导出图形
G.layout()
G.draw(file_name, prog="neato")- prog:布局算法,可选 neato, dot (推荐), twopi, circo, fdp
4 案例
4.1 案例一:因果关系图

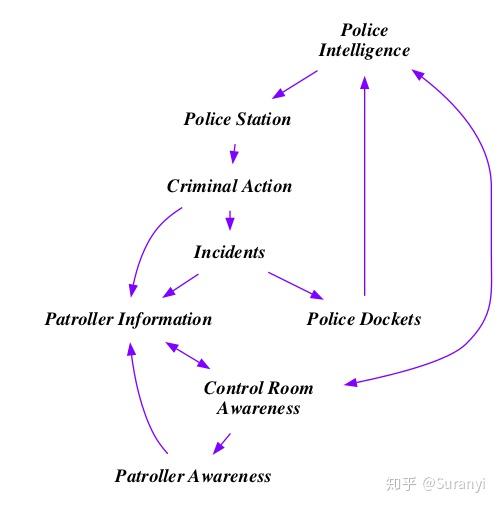
import pygraphviz as pgv

G = pgv.AGraph(directed=True, strict=False, ranksep=0.2, splines="spline", concentrate=True)

# 设置节点标签
nodeA = "Police\nIntelligence"
nodeB = "Police Station"
nodeC = "Criminal Action"
nodeD = "Incidents"
nodeE = "Police Dockets"
nodeF = "Control Room\nAwareness"
nodeG = "Patroller Information"
nodeH = "Patroller Awareness"

# 添加节点
G.add_nodes_from([nodeA, nodeB, nodeC, nodeD, nodeE, nodeF, nodeG, nodeH],
                 color="#ffffff", fontname="times bold italic")

# 添加边
G.add_edges_from([[nodeA, nodeB], [nodeA, nodeF], [nodeB, nodeC], [nodeC, nodeD],
                  [nodeC, nodeG], [nodeD, nodeE], [nodeD, nodeG], [nodeE, nodeA],
                  [nodeF, nodeA], [nodeF, nodeG], [nodeF, nodeH], [nodeG, nodeF],
                  [nodeH, nodeG]], color="#7F01FF", arrowsize=0.8)

# 导出图形
G.layout()
G.draw("因果关系图.png", prog="dot")
4.2 案例二:因子相关性图

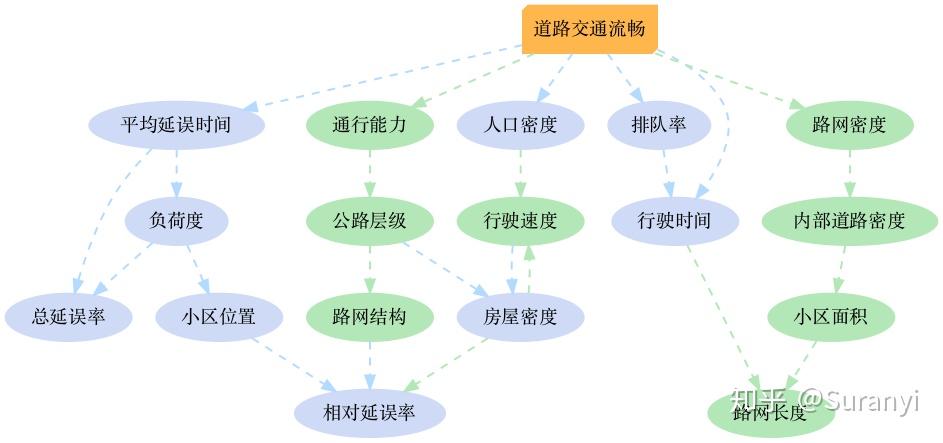
import pygraphviz as pgv

G = pgv.AGraph(directed=True, rankdir="TB")

# 设置节点标签
Root = "道路交通流畅"
negative_1 = "平均延误时间"
negative_2 = "负荷度"
negative_3 = "小区位置"
negative_4 = "相对延误率"
negative_5 = "房屋密度"
negative_6 = "人口密度"
negative_7 = "总延误率"
negative_8 = "排队率"
negative_9 = "行驶时间"
positive_1 = "通行能力"
positive_2 = "公路层级"
positive_3 = "路网结构"
positive_4 = "行驶速度"
positive_5 = "路网长度"
positive_6 = "小区面积"
positive_7 = "内部道路密度"
positive_8 = "路网密度"

# 添加节点
G.add_node(Root, style="filled", shape="box3d", color="#feb64d")
for negative in [eval(_) for _ in dir() if _.startswith("negative")]:
    G.add_node(negative, style="filled", shape="ellipse", color="#CFDBF6")

for positive in [eval(_) for _ in dir() if _.startswith("positive")]:
    G.add_node(positive, style="filled", shape="ellipse", color="#B4E7B7")

# 添加边
G.add_edges_from([[Root, negative_1], [Root, negative_6], [Root, negative_8], [Root, negative_9],
                  [negative_1, negative_2], [negative_1, negative_7], [negative_2, negative_3],
                  [negative_2, negative_7], [negative_3, negative_4], [negative_8, negative_9],
                  [positive_2, negative_5], [positive_3, negative_4], [positive_4, negative_5]],
                 color="#B4DBFF", style="dashed", penwidth=1.5)

G.add_edges_from([[Root, positive_1], [Root, positive_8], [negative_5, negative_4],
                  [negative_6, positive_4], [negative_5, positive_4], [negative_9, positive_5],
                  [positive_1, positive_2], [positive_2, positive_3], [positive_6, positive_5],
                  [positive_7, positive_6], [positive_8, positive_7]],
                 color="#B4E7B7", style="dashed", penwidth=1.5)

# 导出图形
G.layout()
G.draw("因子相关性图.png", prog="dot")
4.3 案例三:简单神经网络图
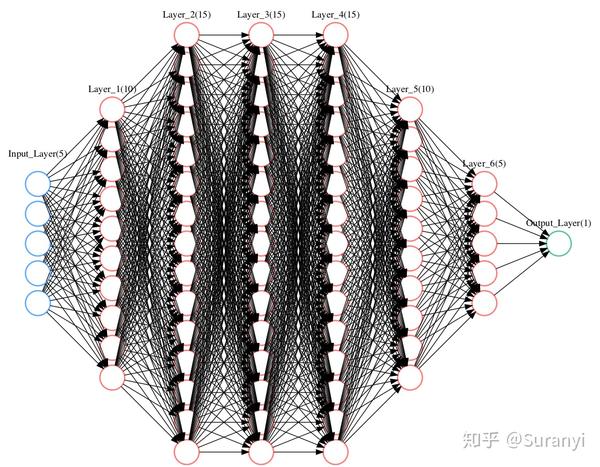
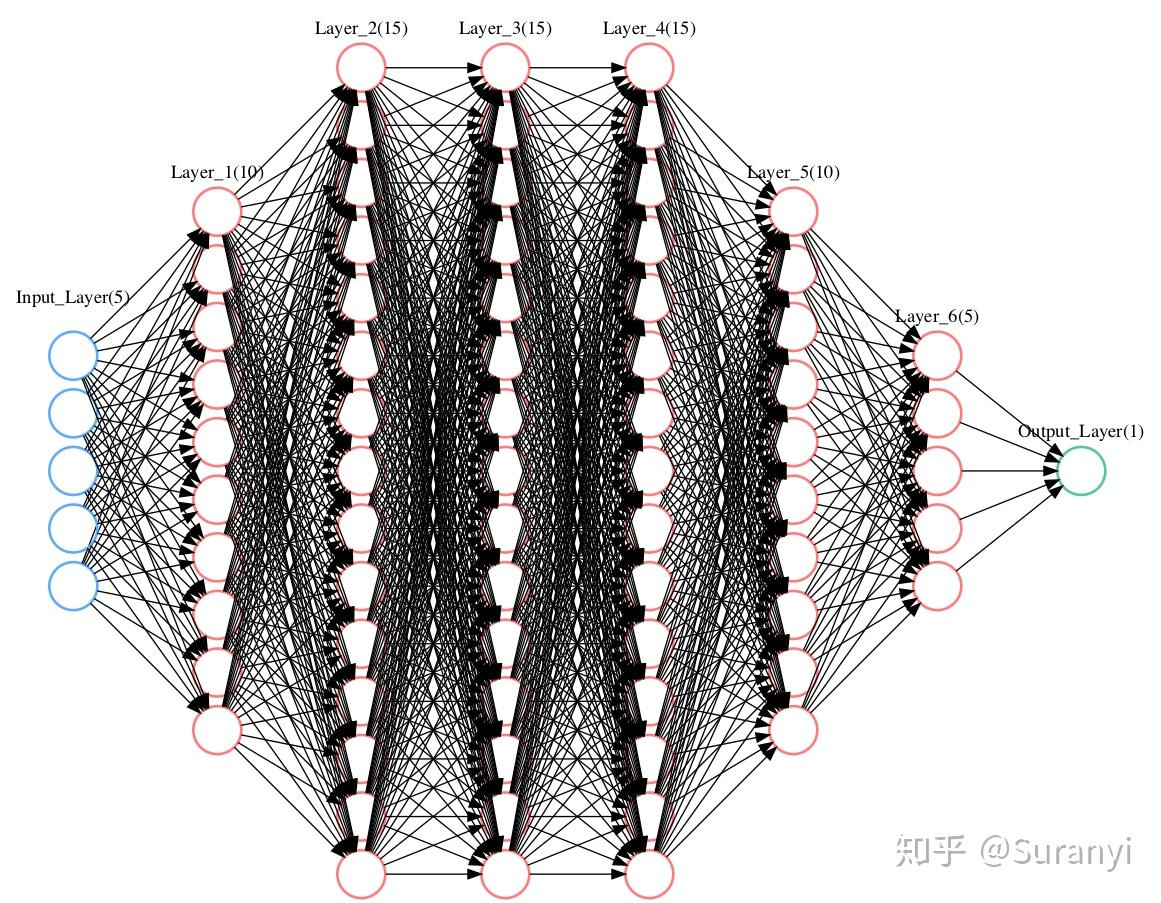
import pygraphviz as pgv

G = pgv.AGraph(directed=True, rankdir="LR")

# 设置层数、每层节点数
network_structure = input("输入神经网络每层节点数,如:[10, 7, 5, 4, 2, 1]\n")
all_nodes = [[f"layer{layer_index}node{node_index}" for node_index in range(layer_nodes_num)] for
             layer_index, layer_nodes_num in enumerate(eval(network_structure))]

# 添加输入层节点
for node_index, node in enumerate(all_nodes[0]):
    G.add_node(node, label="", shape="circle", style="bold", color="#60acfc", pos=f"0,{0.6 * node_index}!")

# 添加输入层文本
G.add_node(f"Input_Layer", shape="none", label=f"Input_Layer({len(all_nodes[0])})",
           pos=f"{0},{(node_index + 1) * 0.6}!")

# 添加中间层、输出层节点
for layer_index, layer in enumerate(all_nodes[1:]):
    color = "#5bc49f" if layer_index == len(all_nodes[1:]) - 1 else "#ff7c7c"

    for node_index, node in enumerate(layer):
        x = 1.5 * (layer_index + 1)
        y = - 0.3 * (len(all_nodes[layer_index + 1]) - len(all_nodes[0])) + 0.6 * node_index
        G.add_node(node, label="", shape="circle", style="bold", color=color, pos=f"{x},{y}!")

    # 添加中间层、输出层文本
    text = f"Output_Layer({len(all_nodes[-1])})" if layer_index == len(all_nodes[1:]) - 1 else f"Layer_{layer_index + 1}({len(layer)})"
    G.add_node(f"Layer_{layer_index + 1})", shape="none", label=text,
               pos=f"{x},{y + 0.4}!")

# 添加线
for layer_index in range(all_nodes.__len__() - 1):
    for start in all_nodes[layer_index]:
        for end in all_nodes[layer_index + 1]:
            G.add_edge(start, end)

# 导出图形
G.layout()
G.draw("神经网络.png")

# 运行代码,输入 [5, 10, 15, 15, 15, 10, 5, 1]
作者:张柳彬
如有疑问,请联系QQ:965579168
不接论文代做, 转载请声明出处
编辑于 2022-08-15 18:38