入门Prometheus监控系统之基础概念和Metric


Prometheus 监控系统的核心整体由三大部分组成:
- Metric 指标,可以先简单理解为监控的数据。巧妇难为无米之炊,metric 是Prometheus监控的核心。
- Prometheus Server 即服务端,负责拉取或接收 metric
- Prometheus Client 即客户端,负责暴露metric给 server 或者 主动推送 metric 给server
最简易的核心架构就如下图所示

- 模式一:Prometheus Server 定时地向目标Client拉取metrics,并处理 —— 这种模式最常见于 Client 是长期在线上跑的服务,比如 http 服务器, 数据库服务器等等
- 模式二:Prometheus Client 也可以主动地把 metrics推送到server —— 这种模式常见于短生命周期的服务,比如图片批处理服务等
(这两种模式不冲突,可共存,但是本系列Prometheus文章侧重于第一种模式)
Prometheus server其实本身也会暴露出 metric,也就是 server 本身也可以是个 Prometheus client。
依照上篇文章
搭起本地 Prometheus 监控系统后,访问 http://localhost:9090/metrics 你就能看到 Prometheus server 暴露的 metrics,下面截了2张图

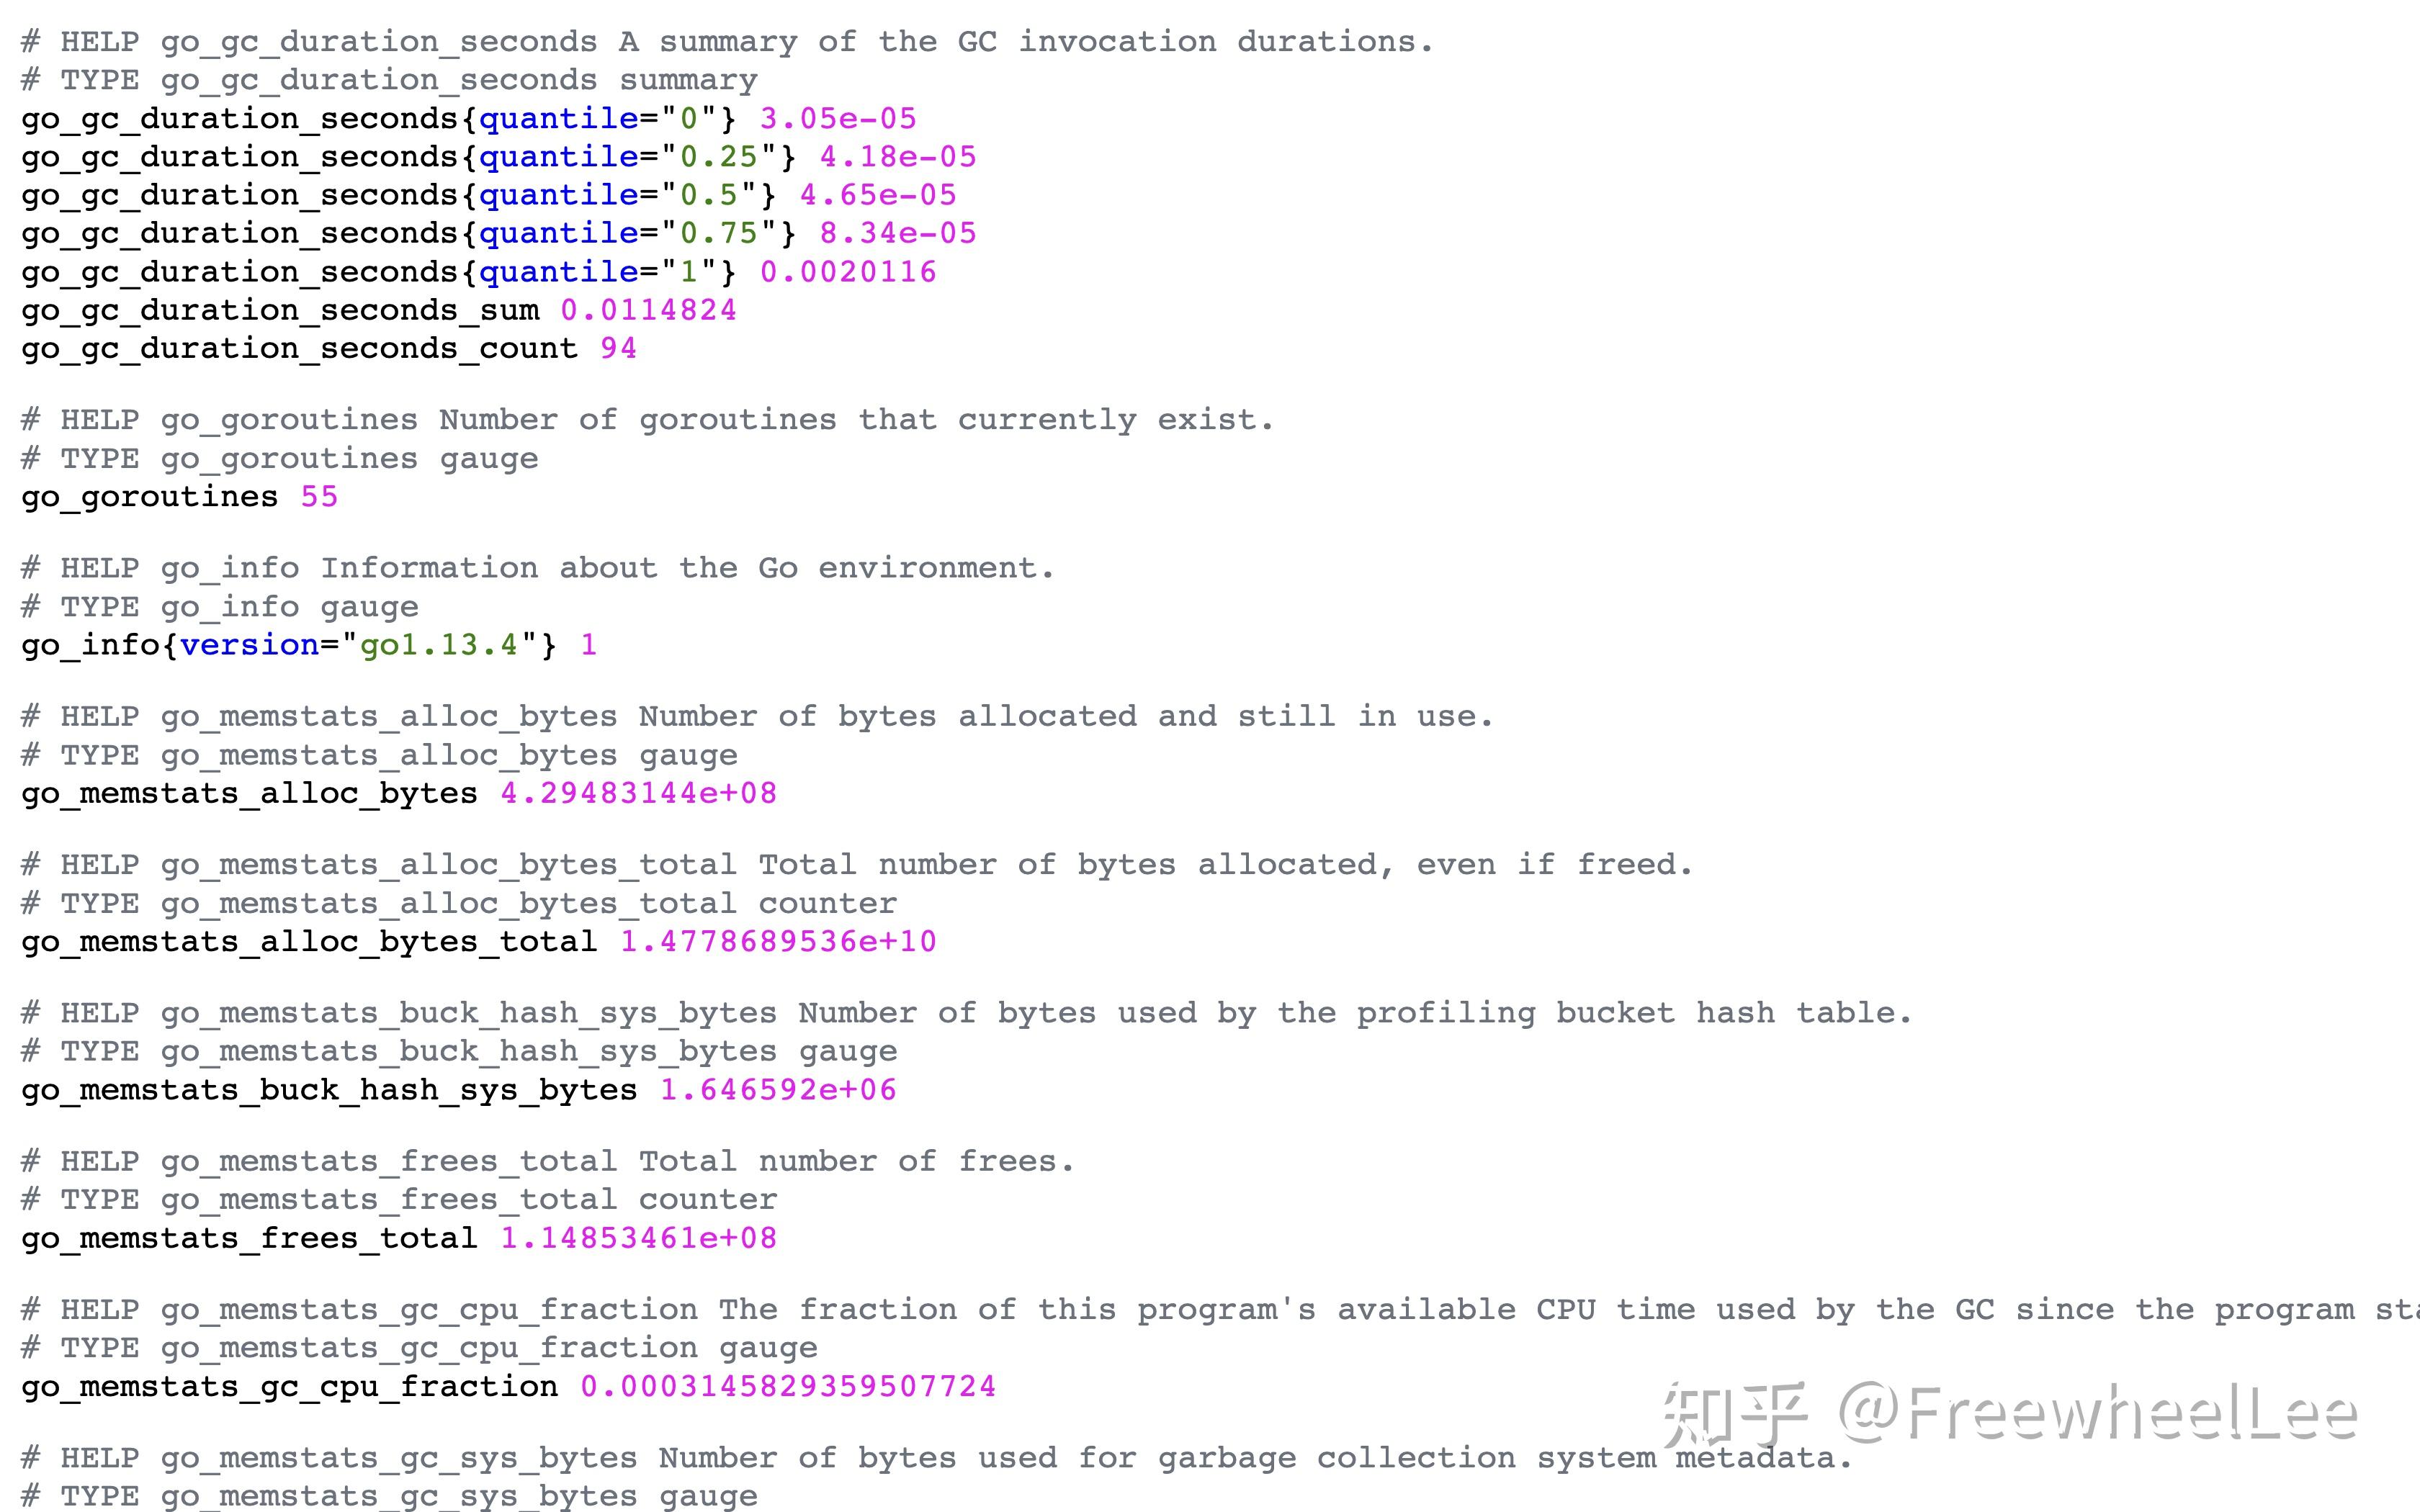
除了以 # 开头的是注释外,其他的就是一行行的metrics了
举例:

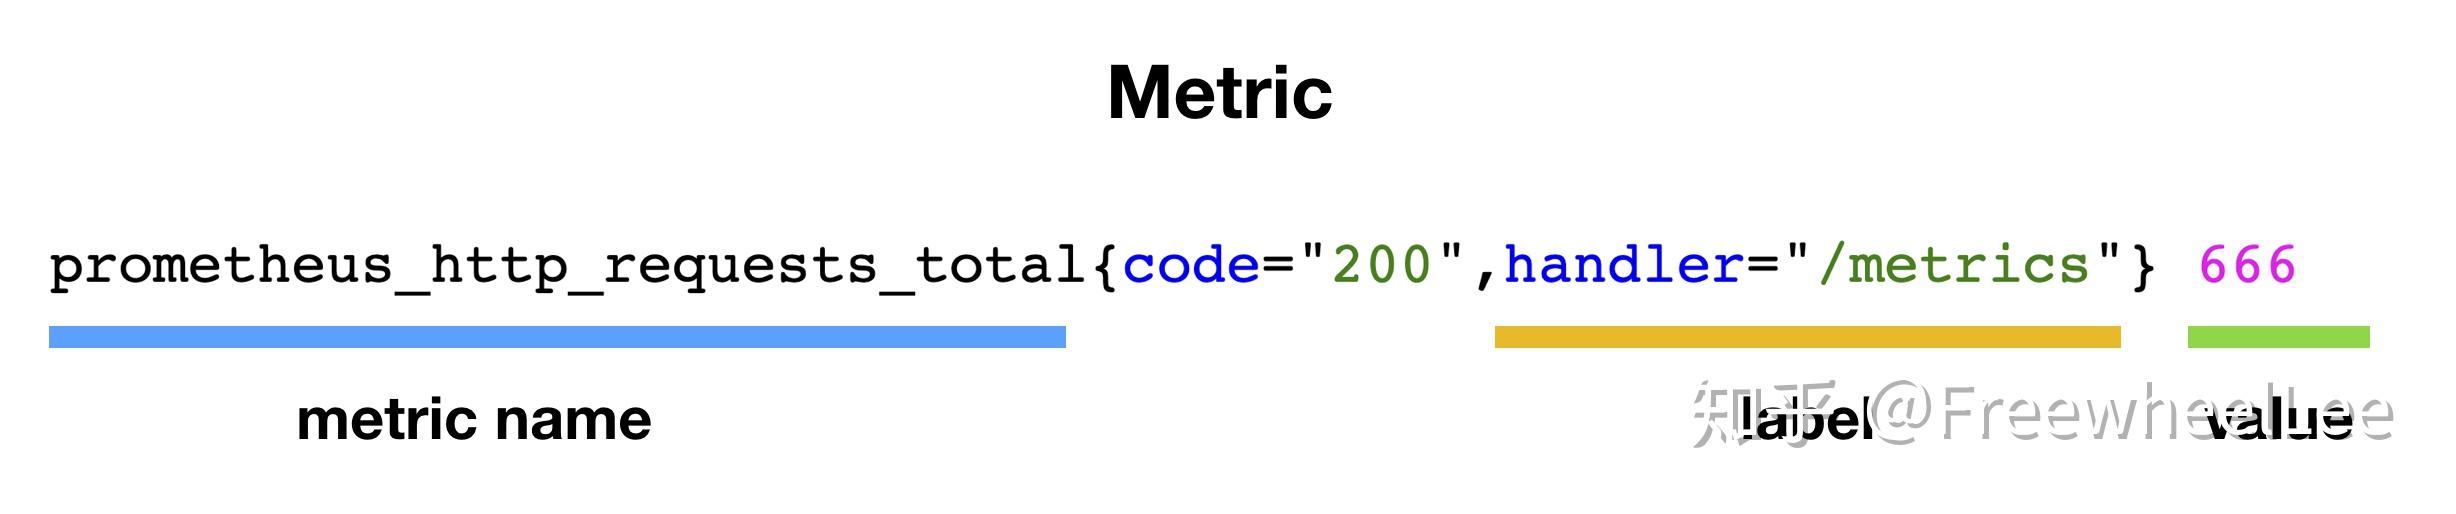
一个Metric数据 由 名字 + labels(可选)+ 值 三部分组成
其中,名字 + labels 构成了 Metric 的唯一性。
即:
1. prometheus_http_requests_total{code="200",handler="/api/v1/query_range"} 376
2. prometheus_http_requests_total{code="200",handler="/graph"} 2
3. prometheus_http_requests_total{code="200",handler="/metrics"} 666
4. prometheus_http_response_size_bytes_sum{handler="/api/v1/label/:name/values"} 9033

5. prometheus_http_requests_total{code="200",handler="/metrics"} 668
1,2,3,4都是不同的metrics
因为4的名字明显不同于前三个,而1,2,3的 label 值不同
3 和 5 是同一个metric, 只是在不同时间有不同的值 —— 注意:在相同时间不可能有相同的metric却有不同的值
(Prometheus Client 暴露的metrics都是实时的,Prometheus server 定时地去采样并且存储在 server 的储存系统里)
Prometheus Metric 有四种类型
Counter
Counter(计数器)是一种累加的metric,这种类型的 metric 的值必须是整数,且只能增不能减(重启后就重置到 0 值),比如可以用来记录 http request的总数
prometheus_http_requests_total{code="200",handler="/metrics"} 666Gauge
Gauge 用于记录一个瞬时的值,能增也能减,比如可以用来记录 cpu 的使用率, 内存剩余率
go_memstats_frees_total 1.14853461e+08Histogram
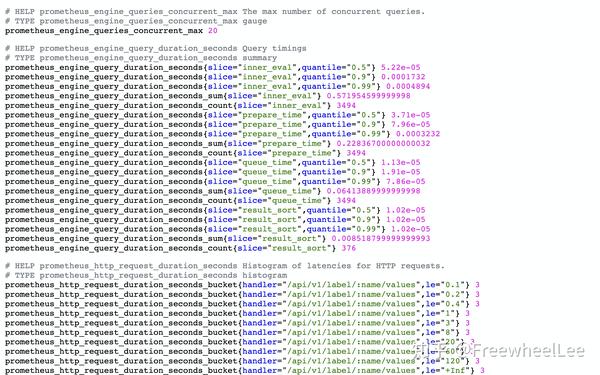
Histogram , 单词的意思是 柱状图。不同于 Counter 和 Gauge,Histogram其实是一组数据,主要用于统计数据分布的情况 —— 统计落在某些值的范围内的计数,同时也提供了所有值的总和和个数
# HELP prometheus_tsdb_compaction_chunk_range_seconds Final time range of chunks on their first compaction
# TYPE prometheus_tsdb_compaction_chunk_range_seconds histogram
prometheus_tsdb_compaction_chunk_range_seconds_bucket{le="100"} 0
prometheus_tsdb_compaction_chunk_range_seconds_bucket{le="400"} 0
prometheus_tsdb_compaction_chunk_range_seconds_bucket{le="1600"} 0
prometheus_tsdb_compaction_chunk_range_seconds_bucket{le="6400"} 0
prometheus_tsdb_compaction_chunk_range_seconds_bucket{le="25600"} 0
prometheus_tsdb_compaction_chunk_range_seconds_bucket{le="102400"} 0
prometheus_tsdb_compaction_chunk_range_seconds_bucket{le="409600"} 0
prometheus_tsdb_compaction_chunk_range_seconds_bucket{le="1.6384e+06"} 28122
prometheus_tsdb_compaction_chunk_range_seconds_bucket{le="6.5536e+06"} 28986
prometheus_tsdb_compaction_chunk_range_seconds_bucket{le="2.62144e+07"} 29090
prometheus_tsdb_compaction_chunk_range_seconds_bucket{le="+Inf"} 29090
prometheus_tsdb_compaction_chunk_range_seconds_sum 2.2733182325e+10
prometheus_tsdb_compaction_chunk_range_seconds_count 29090
其中
prometheus_tsdb_compaction_chunk_range_seconds_bucket{le="1.6384e+06"} 28122
prometheus_tsdb_compaction_chunk_range_seconds_sum 2.2733182325e+10
prometheus_tsdb_compaction_chunk_range_seconds_count 29090
的意思是 少于等于 (less or equals) 1.6384e+06 的 prometheus tsdb compaction chunk range 有 28122 个;
所有 prometheus tsdb compaction chunk range 总和是 2.2733182325e+10 秒,总共 29090 个
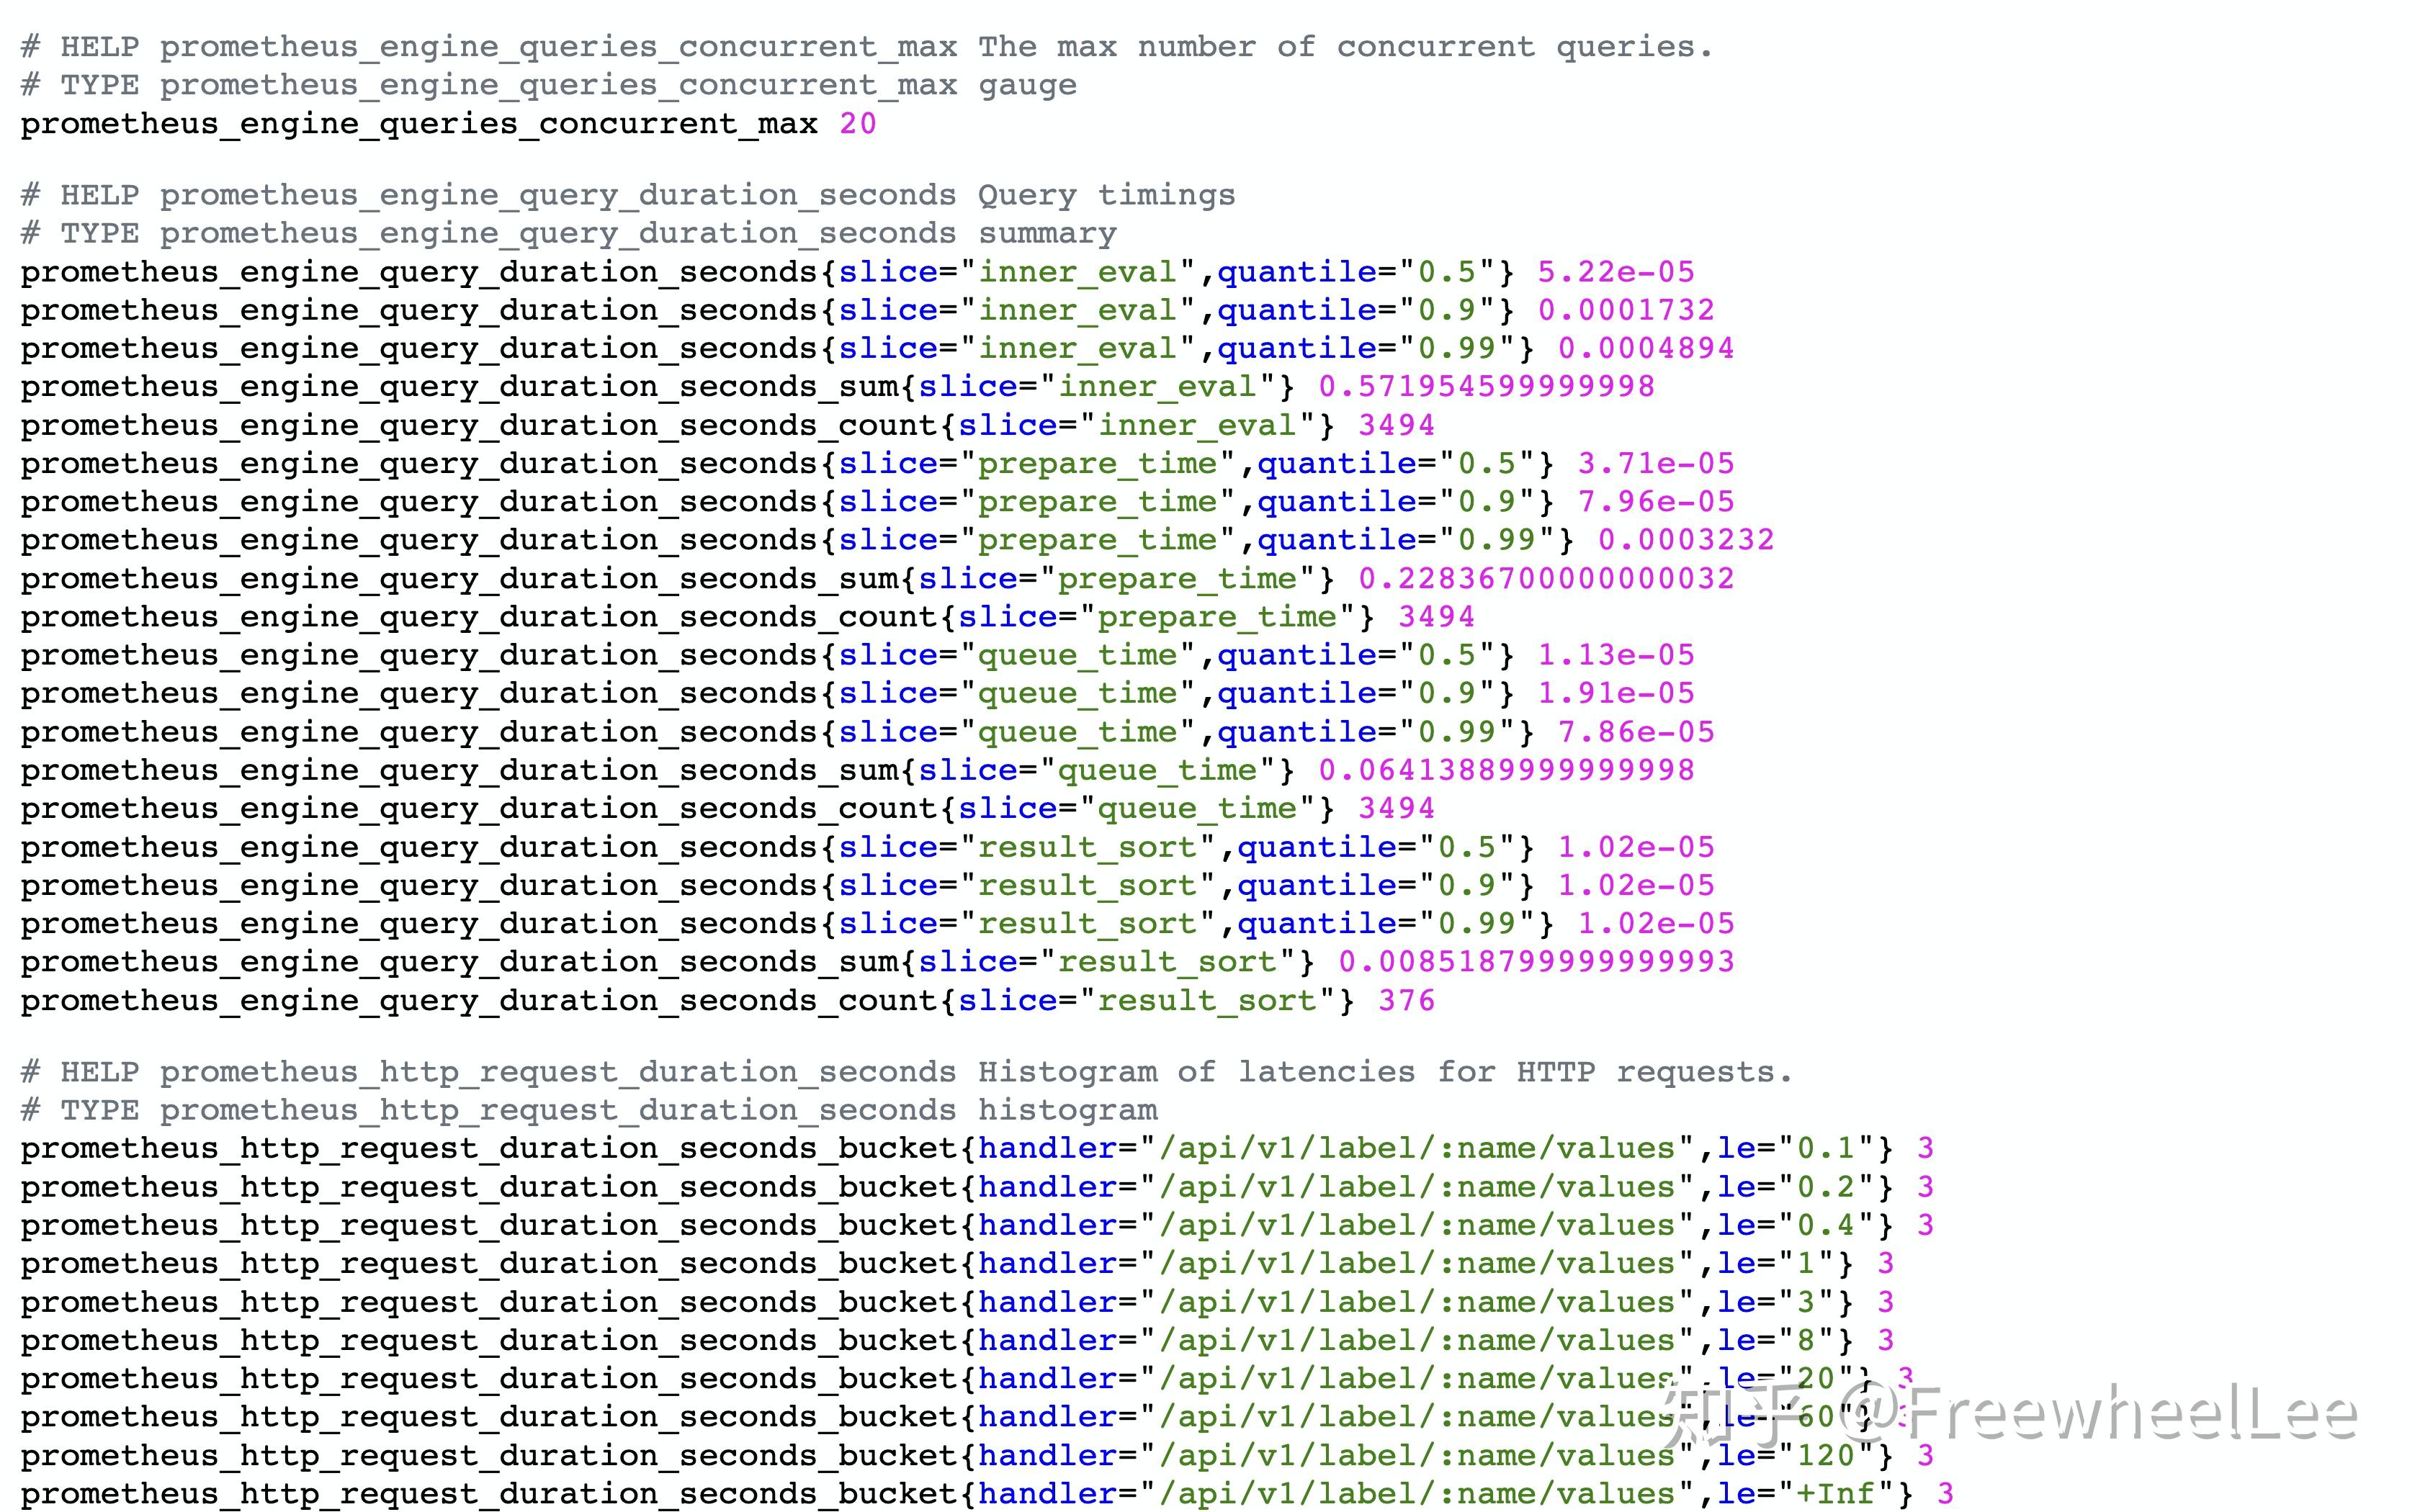
Summary
summary 类似于 histogram,也是一组数据。不同的是,它统计的不是区间的个数而是统计分位数。
# HELP go_gc_duration_seconds A summary of the GC invocation durations.
# TYPE go_gc_duration_seconds summary
go_gc_duration_seconds{quantile="0"} 3.05e-05
go_gc_duration_seconds{quantile="0.25"} 4.18e-05
go_gc_duration_seconds{quantile="0.5"} 4.65e-05
go_gc_duration_seconds{quantile="0.75"} 8.34e-05
go_gc_duration_seconds{quantile="1"} 0.0020116
go_gc_duration_seconds_sum 0.0114824
go_gc_duration_seconds_count 94
其中
go_gc_duration_seconds{quantile="0.5"} 4.65e-05表示 50% 的 go gc duration seconds 是小于等于 4.65e-05 秒的
读者可以访问 http://localhost:9090/metrics 去查看更多的metrics,并思考它们的设计
至此,我们就认识了 Prometheus 的核心架构和 Metric 的概念。
下一篇,我们会学习 Prometheus 的查询语法