
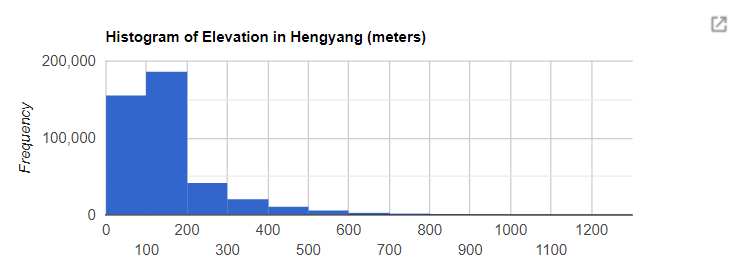
研究区域高程分布直方图展示

对某个区域的DEM高程数据进行分析的时候,可以在GEE直接进行高程直方图分布绘图可视化
// Plot a histogram of elevation in XXX.

var elevation = ee.Image('CGIAR/SRTM90_V4');//高程数据选取
//var colorado = ee.Geometry.Rectangle(-109.05, 37, -102.05, 41);
//将矢量数据上传后筛选出某一城市
var city = ee.FeatureCollection("users/ciscodengyw/Chinacity");
var hengyang = city.filter(ee.Filter.eq("市", "衡阳市"));

// Generate the histogram data.  Use minBucketWidth for nice sized buckets.
var histogram = ui.Chart.image.histogram({
  image: elevation,
  region: hengyang ,
  scale: 200,
  minBucketWidth: 300
});
histogram.setOptions({
  title: 'Histogram of Elevation in Hengyang (meters)'
});

print(histogram);

Map.addLayer(elevation.clip(hengyang));
Map.centerObject(hengyang,8)
结果:

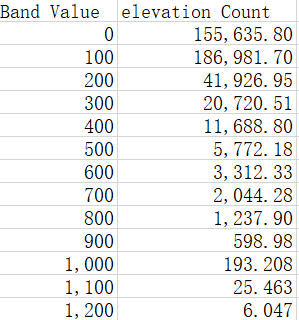
点击右上角分享按钮得到:


可以下载图片与csv文件
关于直方图函数:
ui.Chart.image.histogram(image, region, scale, maxBuckets, minBucketWidth, maxRaw)
作用:从一张影像计算并生成直方图显示
- X-axis: Histogram buckets (of band value).
- Y-axis: Frequency (number of pixels with a band value in the bucket).
Returns a chart.
Arguments:
image (Image):
The image to generate a histogram from.
region (Feature|FeatureCollection|Geometry, optional):
缩减的区域. 默认为整幅影像
scale (Number, optional):
进行直方图缩减时使用的像元尺寸,意思是将原始像元进行一个再采样,单位为米
The pixel scale used when applying the histogram reducer, in meters.
maxBuckets (Number, optional):
The maximum number of buckets to use when building a histogram; will be rounded up to a power of 2.
minBucketWidth (Number, optional):
The minimum histogram bucket width, or null to allow any power of 2.
maxRaw (Number, optional):
The number of values to accumulate before building the initial histogram.