Ceph Dashboard全功能安装集成

1.引言
在这个特殊的时期里,有比较多的时间折腾技术,在前段时间折腾完Cobbler以及Ansible Tower后,想着要折腾啥?这时候想起来,之前看技术文章知道最新版本的Ceph Nautilus官方集成了Dashboard界面,只是看过截图,感觉是很炫酷,在Ceph经历了多年的使用多种第三方Dashboard工具,如:Calamari、VSM等后,终于迎来了官方Dashboard,最初只是想体验下原生的Dashboard是什么样子的,在开始搭建的过程中,发现Dashboard的模式不是直接启用模块所有的功能就能正常使用,初始安装好只有最基本的Ceph集群以及RBD管理等功能,像文件存储、对象存储、iSCSI网关、NFS网关、监控都是没有集成的,都需要单独集成,Ceph启用Dashboard的资料网上能找到的多数是直接启用Dashboard模块,集成其它模块的中文资料也很少,因此也开启了一路不断踩坑不断验证的模式,历时数十天终于安装集成完毕,现总结下经验,供同行参考,避免大家浪费时间踩坑,故引出此文。
2.Ceph Dashboard介绍
Ceph的官方Dashboard正式是从Ceph luminous版本开始,最初是一个简单的只读视图,可查看Ceph集群的各种运行时信息和性能数据,而无需身份验证或任何管理功能。
Ceph Nautilus后的Dashboard可实现管理Ceph的功能,其来源于suse收购的的商业Ceph管理软件openATTIC的功能移植。
现在的Ceph Dashboard后端代码使用CherryPy框架和自定义REST API实现。WebUI基于Angular 实现。

3.实验环境介绍
本实验环境使用4台虚拟机,使用workstation搭建,部署节点使用2vCPU、2GB内存,20Gb磁盘,存储节点每台虚拟机配置2vCPU、2GB内存、1块20Gb系统盘、3块100G数据盘,1块网卡(为了简单没有区分群集网和存储网),节点使用的操作系统为CentOS7.7最小化安装。
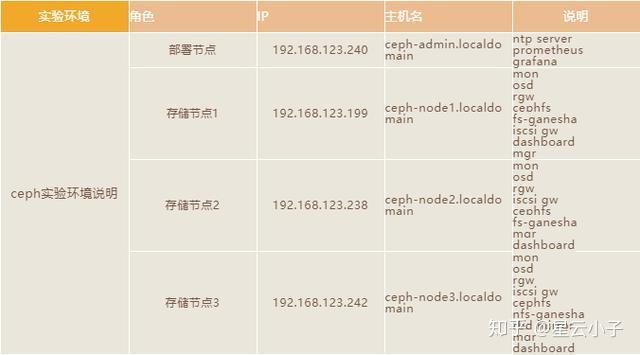

注意:每台虚拟机主机名称必须按照上表中的名称命名,因为在安装MON的时候会调用每一台的主机名,所以不能是默认的localhost。
4.安装方式说明
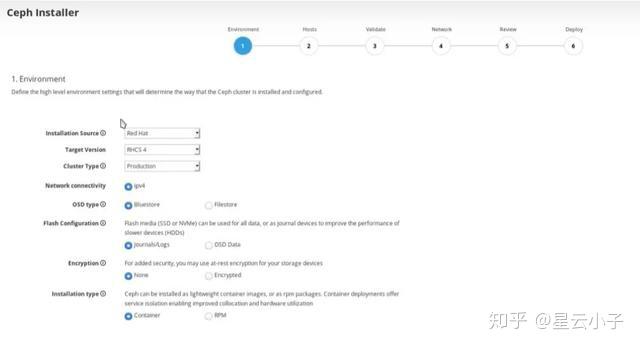
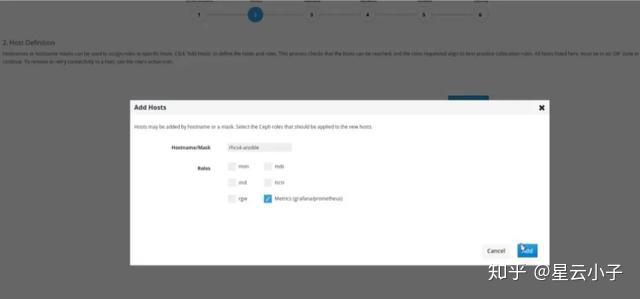
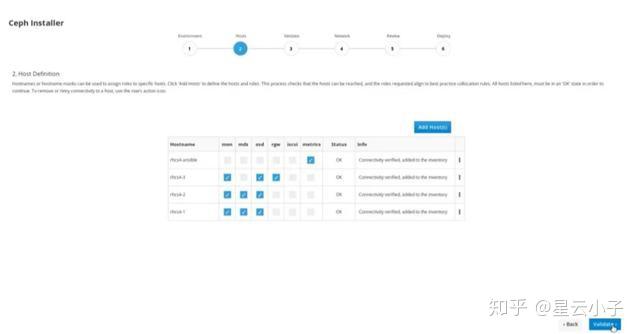
本文主要是参考官方文档手工安装的方式,当然一些商业版本的Ceph已经实现了图形化安装,比如像Redhat 最新版本Red Hat Ceph Storage 4已经实现图形化安装,如下图所示,有兴趣可以尝试下。


5.准备工作
5.1 配置防火墙
为了最大程度简化实验步骤,关闭每一台节点的防火墙功能,生产环境中请根据实际情况打开并开放相应端口。
 #systemctl stop firewalld
 #systemctl disable firewalld
5.2 配置SELINUX
为了防止出现由于SELinux引起意外问题,关闭每一台的SELinux。
#setenforce 0
#sed -i "s/SELINUX=enforcing/SELINUX=disabled/g" /etc/selinux/config
5.3 配置安装工具源
在每一台节点上安装epel源。
#yum install https://mirrors.cloud.tencent.com/epel/epel-release-latest-7.noarch.rpm -y5.4 配置域名解析
配置本地主机名解析。
 #vi /etc/hosts
192.168.123.240 ceph-admin ceph-admin.localdomain
192.168.123.199 ceph-node1 ceph-node1.localdomain
192.168.123.238 ceph-node2 ceph-node2.localdomain
192.168.123.242 ceph-node3 ceph-node3.localdomain
温馨提醒
此处必须设置FQDN,也就是完全合格域名,不能只是主机名,否者在启用iSCSI网关是会出现错误,在后方中会详细介绍故障现象,此处只要记住必须要设置FQDN就行;
ceph dashboard中 prometheus、iscsi target以及mgr service中都需要FQDN,所以这步比较重要,确保各主机能相互解析。
5.5 配置NTP
每一台上安装NTP服务,并设置管理节点为NTP Server,其它节点为Client节点。
#yum install chrony -y配置Ceph-admin节点为ntp server。
#vi /etc/chrony.conf
allow 192.168.123.0/24
重启chrony服务。
#systemctl restart chronyd配置其它Ceph节点为ntp client。
#vi /etc/chrony.conf
server ceph-admin iburst
重启chrony服务。
#systemctl restart chronyd
在其它节点确认配置好了NTP
#chronyc sources
210 Number of sources = 4
MS Name/IP address         Stratum Poll Reach LastRx Last sample
===============================================================================
^* ceph-admin                      3   9     0   68m    +39us[  +45us] +/-   18ms
^- time.cloudflare.com           3  10   352   49m  +5653us[+5653us] +/-   71ms
^? de-user.deepinid.deepin.>     3  10    21   21m  -2286us[-2286us] +/-   97ms
^? 2402:f000:1:416:101:6:6:>     0   6     0     -     +0ns[   +0ns] +/-    0ns
5.6 升级系统内核
由于需要配置iscsi网关,而iscsi网关需要操作系统内核版本为Linux内核v4.16(或更高版本),所以需要升级CentOS7.7的系统内核。
查看当前使用的内核版本。
#uname -r
3.10.0-862.el7.x86_64
导入public key。
#rpm --import https://www.elrepo.org/RPM-GPG-KEY-elrepo.org
#yum install https://www.elrepo.org/elrepo-release-7.0-3.el7.elrepo.noarch.rpm -y
#yum --enablerepo=elrepo-kernel install  kernel-ml-devel kernel-ml -y
查看安装的内核版本。
#rpm -qa | grep kernel
kernel-ml-5.5.8-1
设置kernel默认启动项。
# grub2-set-default "kernel-ml-5.5.8-1"查看新设置的默认的启动项,并重启系统。
#grub2-editenv list6.正式开始搭建Ceph
6.1 配置Ceph源
在部署节点配置Ceph-deploy工具的国内yum源。
#vi /etc/yum.repos.d/ceph.repo
[ceph-noarch]
name=Ceph noarch packages
baseurl=http://mirrors.163.com/ceph/rpm-nautilus/el7/noarch
enabled=1
gpgcheck=1
priority=1
type=rpm-md
gpgkey=http://mirrors.163.com/ceph/keys/release.asc
6.2 安装Ceph-Deploy
在部署节点安装Ceph-deploy工具,并查看版本为2.0.1,注意不配置Ceph-deploy yum源,默认也可以下载ceph-deploy,但下载的是1.5,此版本有bug,需要安装额外缺失的包才能正常使用。
#yum install python-setuptools -y
#yum install ceph-deploy -y
#ceph-deploy --version
2.0.1
6.3 配置无密码登录
配置无密码登录。
#ssh-keygen
#ssh-copy-id root@ceph-node1.localdomain
#ssh-copy-id root@ceph-node2.localdomain
#ssh-copy-id root@ceph-node3.localdomain
6.4 开始安装Ceph
创建初始化目录。
#mkdir my-cluster&&cd my-clusterceph-deploy生产一些文件到当前目录。执行部署时请确保您位于此目录下。
创建命名为ceph集群。
#ceph-deploy new ceph-node1.localdomain ceph-node2.localdomain ceph-node.localdomain检查当前目录中会出现ceph.conf,ceph.mon.keyring文件。
安装Ceph软件包,默认ceph-deploy会自动下载匹配版本的ceph,想要自动定义安装版本使用--release指定安装的Ceph版本以及使用--repo-url指定自动配置的Ceph yum源,不指定--repo-url,Ceph-deploy会自动配置成国外的Ceph源,国内访问慢,容易安装失败。
这里指定的主机名需要和做ssh免密码登录的主机名相同,否者还是会提示输入密码。
#ceph-deploy mon create-initial部署mon。
#ceph-deploy mon create-initial温馨提醒
执行此命令前需要确保每台存储节点主机名为第三章节中规划的主机名,否者会报错。
执行此命令后会生成如下文件。
#cd my-cluster&ls
ceph.client.admin.keyring
ceph.bootstrap-mgr.keyring
ceph.bootstrap-osd.keyring
ceph.bootstrap-mds.keyring
ceph.bootstrap-rgw.keyring
ceph.bootstrap-rbd.keyring
ceph.bootstrap-rbd-mirror.keyring
推送配置文件到各Ceph节点。
#ceph-deploy admin ceph-node1.localdomain ceph-node2.localdomain ceph-node3.localdomain初始化OSD。
#ceph-deploy osd create --data /dev/sdb ceph-node1.localdomain
#ceph-deploy osd create --data /dev/sdc ceph-node1.localdomain
#ceph-deploy osd create --data /dev/sdd ceph-node1.localdomain
#ceph-deploy osd create --data /dev/sdb ceph-node2.localdomain
#ceph-deploy osd create --data /dev/sdc ceph-node2.localdomain
#ceph-deploy osd create --data /dev/sdd ceph-node2.localdomain
#ceph-deploy osd create --data /dev/sdb ceph-node3.localdomain
#ceph-deploy osd create --data /dev/sdc ceph-node3.localdomain
#ceph-deploy osd create --data /dev/sdd ceph-node3.localdomain
在3个存储节点上都部署mgr。
#ceph-deploy mgr create ceph-node1.localdomain
#ceph-deploy mgr create ceph-node2.localdomain
#ceph-deploy mgr create ceph-node3.localdomain
检查Ceph群集状态。
#ceph -s6.5 安装Dashboard
至此ceph群集安装完成,但还没有启用Dashboard插件,下面我们开始配置Dashboard插件
在所有dashboard节点上安装插件包。
#yum install -y ceph-mgr-dashboard -y开启插件。
#ceph mgr module enable dashboard禁用SSL。
#ceph config set mgr mgr/dashboard/ssl false配置监听IP。
#ceph config set mgr mgr/dashboard/server_addr 0.0.0.0温馨提醒
此处必须设置监控地址为0.0.0.0,而不能是直接IP地址,因为其监控的是所有本地地址包括IPV4和IPV6,同时也不能禁用IPV6地址。
配置监听端口。
#ceph config set mgr mgr/dashboard/server_port 8443设置用户及密码。
#ceph dashboard ac-user-create admin 123456 administrator查看已开启模块信息。
#ceph mgr services使用配置生效。
#ceph mgr module disable dashboard
#ceph mgr module enable dashboard
通过查看ceph mgr services命令输出地址。
#ceph mgr services
{
"dashboard": "http://ceph-node1.localdomain:8443/"
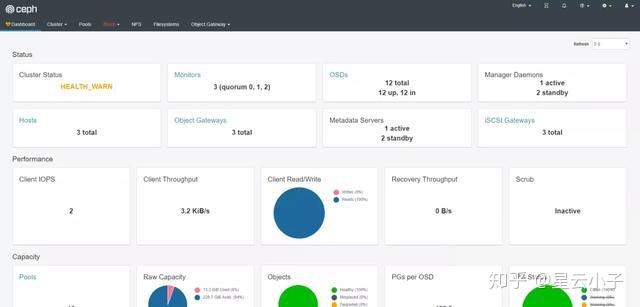
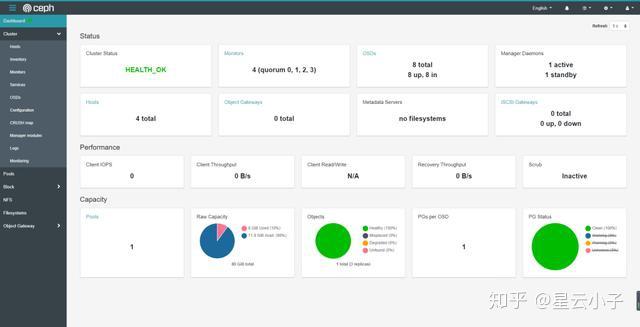
}访问Ceph Dashboard地址http://192.168.123.199:8443/#/dashboard
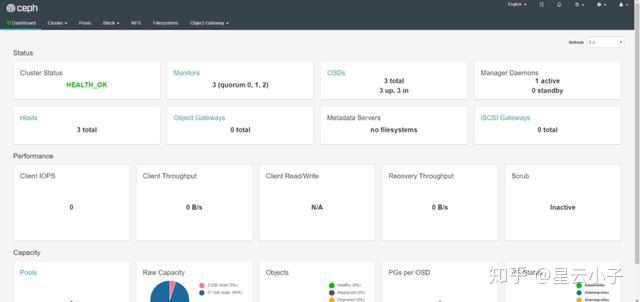

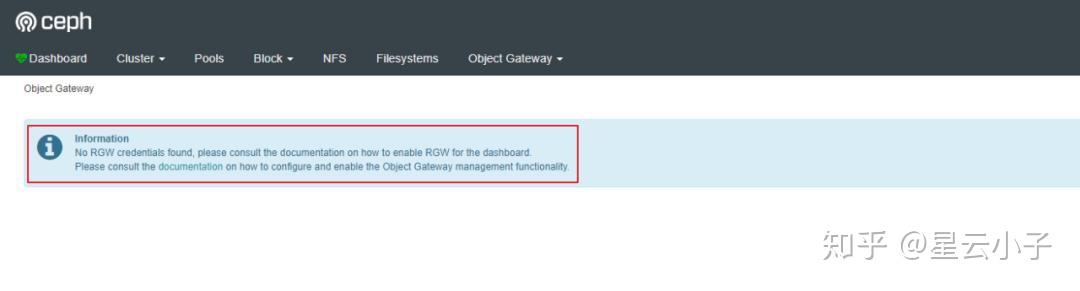
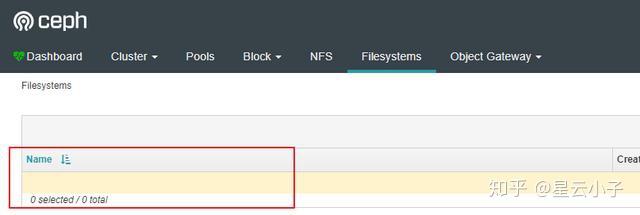
至此Dashboard安装完成,但其它的功能,如:rgw,cephfs,iscsi,监控等都需要手工启用,需要一个个启用这些功能,如下图所示:
rgw没有启用:

cephfs没有启用:

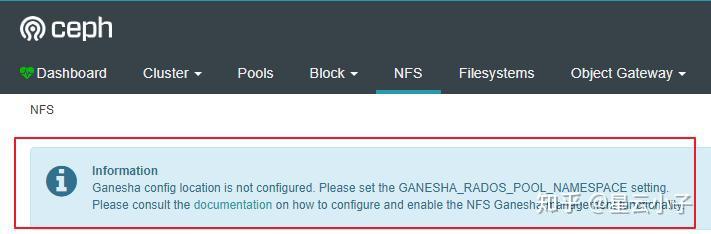
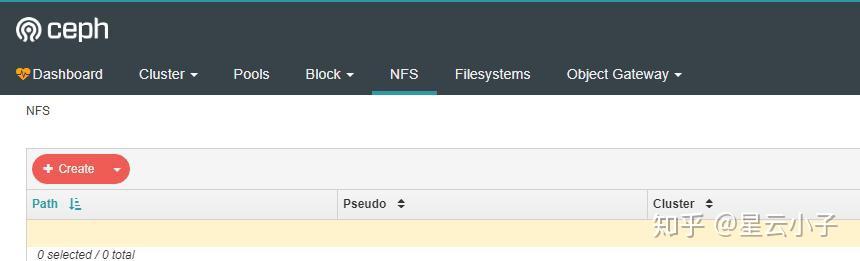
nfs没有启用:

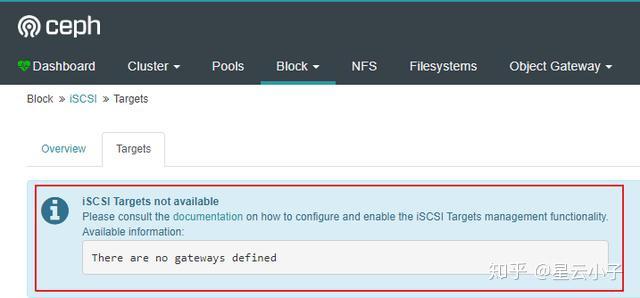
iscsi没有启用:

监控没有启用:


6.6 安装RGW
默认Ceph没有安装rgw,需要安装rgw,在所有rgw节点上安装。
#ceph-deploy install --rgw --release nautilus ceph-node1.localdomain ceph-node2.localdomain ceph-node3.localdomain--repo-url http://mirrors.163.com/ceph/rpm-nautilus/el7/ --gpg-url http://mirrors.163.com/ceph/keys/release.asc创建rgw实例。
#ceph-deploy rgw create ceph-node1.localdomain
#ceph-deploy rgw create ceph-node2.localdomain
#ceph-deploy rgw create ceph-node3.localdomain
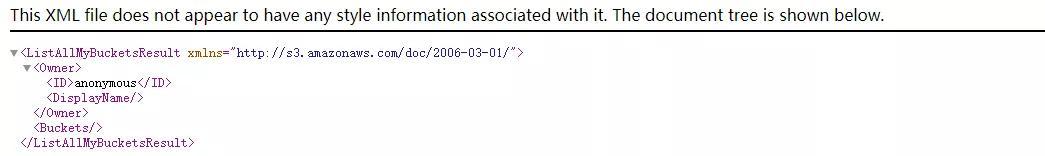
命令执行后,可以通过http://rgw-node:7480测试是否安装成功,出现以下内容证明rgw安装成功。

6.7 Dashboard中启用RGW
如前文所讲,Ceph Dashboard默认安装好后,没有启用rgw,需要手工Dashboard中启用RGW,以下命令都在Ceph存储节点执行。
创建rgw系统账户。
#radosgw-admin user create --uid=rgw --display-name=rgw --system记下输出的access_key 和 secret_key的值,当初没有记下也可以通过以下命令查看(可选)
#radosgw-admin user info --uid=rgw为Dashboard设置access_key 和 secret_key。
#ceph dashboard set-rgw-api-access-key <access_key>
#ceph dashboard set-rgw-api-secret-key <secret_key>
禁用SSL。
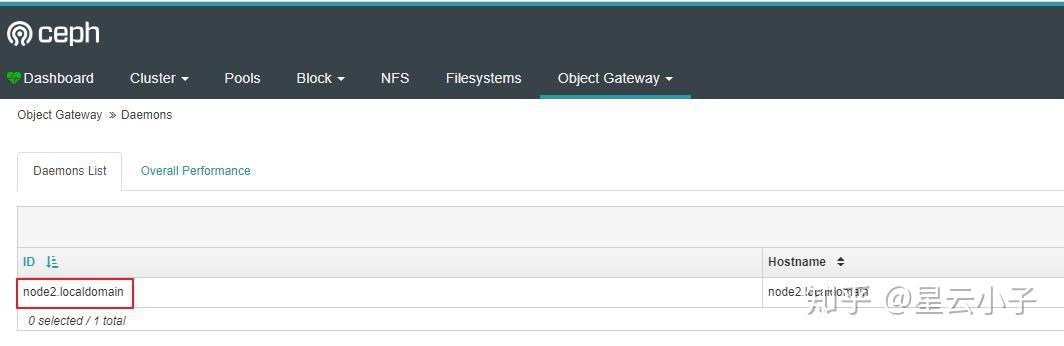
#ceph dashboard set-rgw-api-ssl-verify False这时候打开Dashboard就能看到rgw信息能正常显示了。

6.8 安装Cephfs
如前文所讲,Ceph Dashboard默认安装好后,没有启用ceogfs,需要手工Dashboard中启用cephfs,以下命令除了ceph-deploy命令在部署节点执行,其他命令都在ceph节点执行。
#ceph-deploy mds create ceph-node1.localdomain
#ceph-deploy mds create ceph-node2.localdomain
#ceph-deploy mds create ceph-node3.localdomain
创建池。
#ceph osd pool create cephfs_data 32
#ceph osd pool create cephfs_metadata 32
创建文件系统。
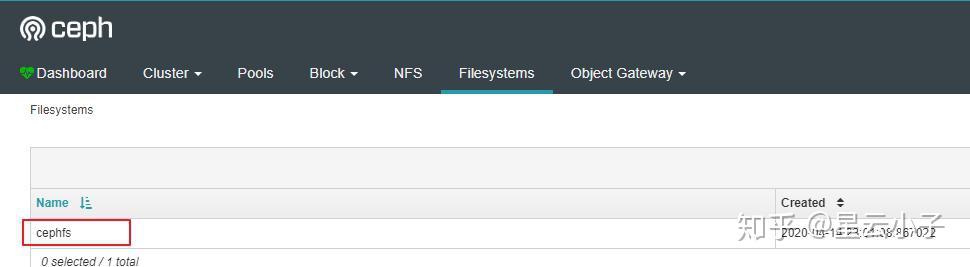
#ceph fs new cephfs cephfs_metadata cephfs_data查看mds状态。
#ceph mds stat
cephfs:1 {0=node3.localdomain=up:active}
Ceph fs不需要做其它集成工作,所以直接在Dashboard中就可以显示了。

6.9 配置nfs
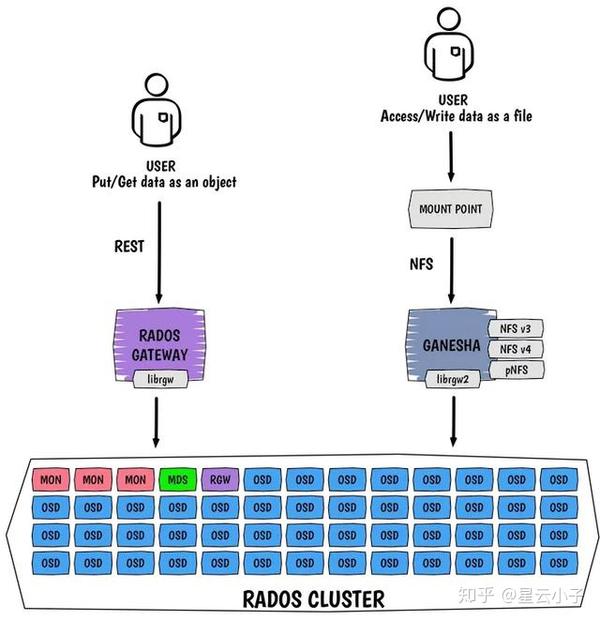
自从Ceph Jewel版本,nfs-ganesha开始支持ceph,ganesha通过两种方式支持将ceph导出为nfs。一种通过rgw,一种通过cephfs,FSAL_RGW调用librgw2将NFS协议转义为S3协议再通过RGW存入到Ceph中,FSAL_CEPH 调用libcephfs2将NFS转义为Cephfs协议再存入到Ceph 中,但之前都是命令行方式的支持,在Ceph Nautilus中Ceph Dashboard现在也支持配置这两种方式的NFS。

在ganesha节点查看是否安装librgw2和libcephfs2软件包。
#rpm -qa |grep librgw
librgw2-14.2.7-0.el7.x86_64
# rpm -qa |grep libcephfs
libcephfs2-14.2.7-0.el7.x86_64
在ganesha节点上配置nfs-ganesha源。
#vi /etc/yum.repos.d/nfs-ganesha.repo
[nfs-ganesha]
name=nfs-ganesha
baseurl=http://us-west.ceph.com/nfs-ganesha/rpm-V2.7-stable/nautilus/x86_64/
enabled=1
priority=1
在所有ganesha节点上安装ganesha。
#yum install nfs-ganesha nfs-ganesha-ceph nfs-ganesha-rgw -y设置服务启动以及开机启动。
#systemctl start nfs-ganesha.service
#systemctl status nfs-ganesha.service
#systemctl enable nfs-ganesha.service
新建ganesha_data的pool,此pool专门用来存放一些配置文件,Dashboard管理NFS需要有些配置文件存放在Rados pool中。
#ceph osd pool create ganesha_data 16新建空的daemon.txt文本文件。
#touch daemon.txt导入daemon文件到ganesha_data pool中。
#rados -p ganesha_data put conf-ceph-node1.localdomain daemon.txt
#rados -p ganesha_data put conf-ceph-node2.localdomain daemon.txt
#rados -p ganesha_data put conf-ceph-node3.localdomain daemon.txt
温馨提醒
1.存入rados的文件名必须要是conf-xxxx,原因是要Ceph Dashboard支持NFS Ganesha管理功能,需要遵循关于每个服务守护进程的RADOS对象名称的约定。对象的名称必须是conf-<daemon_id>格式,其中<daemon_id>对应于运行此服务的节点名称。<daemon_id>是一个任意字符串,应唯一地标识该守护程序实例(例如,运行守护程序的主机名)。
2.当然我们创建这个文件现在是空的,后续通过Dashboard创建导出后,conf-<daemon_id>会有内容,每个conf-<daemon_id>都包含指向NFS-Ganesha守护程序应服务的导出的RADOS URL。这些URL的格式为:%url rados://<pool_name>[/<namespace>]/export-<id>,在创建新的导出时也同时会创建export-id的文件,这个文件内容存放实际的导出的配置内容,也就是之前没有配置Dashboard时,直接配置在ganesha配置文件中的EXPORT{}的内容。
3.conf-<daemon_id>和export-<id>对象必须存储在同一个RADOS池/命名空间,当然如果是通过Dashboard配置的这两个文件肯定是在同个pool,如果手工创建的话就需要注意这点。
查看gaensha pool中存在conf-ceph-node3.localdomain。
#rados -p ganesha_data ls
conf-ceph-node1.localdomain
conf-ceph-node2.localdomain
conf-ceph-node3.localdomain
查看当前Ceph节点的rgw认证信息,如,下图输出client.rgw.ceph-node3.localdomain,为后续每一台虚拟机ganesha配置文件中RGW部分name的值。
#ceph auth list
installed auth entries:
client.rgw.ceph-node3.localdomain
key: AQABu2decDx5IhAA4/7I9iNzFkQE9s4A6XQTtw==
caps: [mon] allow rw
caps: [osd] allow rwx
编辑每一台节点ganesha配置文件,并根据当前所在节点输入以下内容,如下图显示的是存储节点3的配置信息,请根据情况替换成其它存储节点配置信息。
#vi /etc/ganesha/ganesha.conf
RADOS_URLS {
    ceph_conf = "/etc/ceph/ceph.conf";
    Userid = "admin";
    watch_url = "rados://ganesha_data/conf-ceph-node3.localdomain";
}
%url rados://ganesha_data/conf-ceph-node3.localdomain
RGW {
        ceph_conf = "/etc/ceph/ceph.conf";
        name = "client.rgw.ceph-node3.localdomain";
        cluster = "ceph";
}
此配置文件包括3部分内容:
1.RADOS_URLS部分
- ceph_confi主要是配置ceph的配置文件路径
- Userid主要是配置访问rados的用户名admin
- watch_url主要是配置,当通过Dashboard生成新的配置文件存入在rados中,ganesha进程可以读取新的内容并通过SIGHUP重新加载配置文件。
2.%url部分
- NFS Ganesha支持从RADOS对象读取配置。该 %url指令允许指定一个RADOS URL,该URL标识RADOS对象的位置。
3.RGW部分
- cluster 设置一个Ceph集群名称(必须与正在导出的集群匹配,默认使用ceph-deploy部署的ceph群集名称为ceph)
- name 设置RGW实例名称(必须与正在导出的集群中的rgw节点的认证信息匹配,使用ceph auth list可以查看以client.rgw.开头的信息)
- ceph_conf 给出了要使用的非默认ceph.conf文件的路径,默认路径可以省略此行。
温馨提醒
想要在Dashbaord中能显示NFS配置界面,不能像网上的文章没有配置Dashboard中使用NFS步骤一样,在Dashbaord中显示NFS配置,需要有部分配置文件存储在Rados对象存储中:
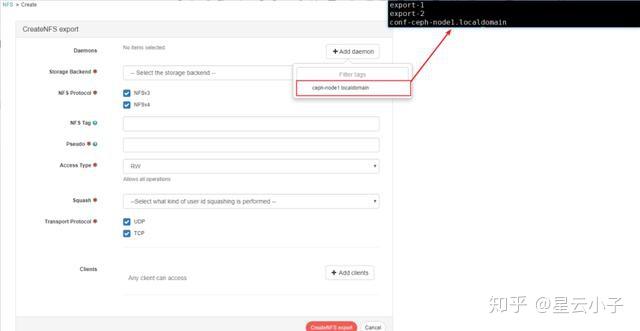
1.原先在ganesha配置文件中的EXPORT部分内容需要存放在rados文件中,这部分是直接通过Dashboard中配置生成以export-id并存放在rados中。
2.Dashboard中有需要选择"add deamon“菜单内容,这里正常是能显示对应的主机名称,要想显示这内容,需要部分配置的内容是需要存放在rados的pool中,也就是pool中存放这conf-xxx,同时需要导出的目录也是存放conf-xxx的目录,否者Dashboard NFS配置中“add deamon”功能中显示为空,不能正常选择要导出节点名称。

要在Ceph仪表板中启用NFS-Ganesha管理,我们只需要告诉仪表板要导出哪个pool,比如以下是导出cephfs_data pool。
#ceph dashboard set-ganesha-clusters-rados-pool-namespace ganesha_data温馨提醒
此处导出目录必须是前面创建的ganesha_data存储池,也就是导出的池必须有conf-xxx文件,在Dashboard中才能显示。
重启ganesha服务,并设置开机启动。
#systemctl restart nfs-ganesha
#systemctl status nfs-ganesha
这时候打开Ceph Dashboard就能看到NFS模块正常显示了:

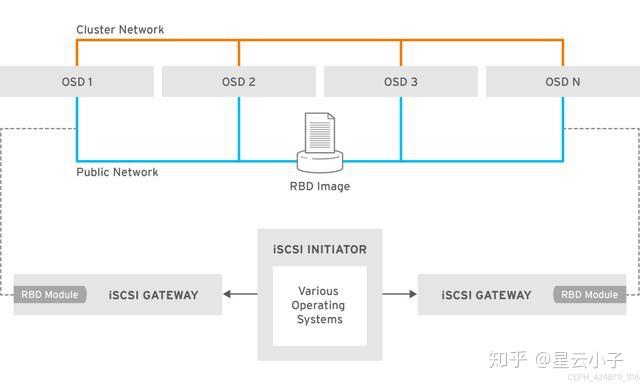
6.10 配置iscsi gw
之前Ceph存储集群的块存储不支持iscsi,从Ceph Luminous版本开始支持iSCSI。
Ceph中实现iscsi 方式有两种,一种是通过Linux target framework(tgt)实现,一种是通过Linux-IO Target(lio)实现,本文是使用的方式是LIO,LIO现在也是官方推荐的方式。
LIO的实现方式主要是利用TCMU与Ceph的librbd库进行交互,并将RBD images映射给iSCSI客户端,所以需要有TCMU软件包安装在系统中。
启用iscsi gateway需要满足以下条件:
- 正在运行的Ceph Luminous(12.2.x)集群或更高版本
- CentOS 7.5(或更高版本);Linux内核v4.16(或更高版本)
- 该ceph-iscsi软件包安装在所有iSCSI网关节点上
- 如果Ceph iSCSI网关未位于OSD节点上,则将位于中的Ceph配置文件/etc/ceph/从存储集群中正在运行的Ceph节点复制到iSCSI Gateway节点。Ceph配置文件必须存在于iSCSI网关节点下的/etc/ceph/。
iscsi gw示意图如下:

在所有iscsi gw节点上配置ceph-iscsi yum源。
#vi /etc/yum.repos.d/ceph-iscsi.repo
[ceph-iscsi]
name=ceph-iscsi noarch packages
baseurl=http://download.ceph.com/ceph-iscsi/3/rpm/el7/noarch
enabled=1
gpgcheck=1
gpgkey=https://download.ceph.com/keys/release.asc
type=rpm-md
[ceph-iscsi-source]
name=ceph-iscsi source packages
baseurl=http://download.ceph.com/ceph-iscsi/3/rpm/el7/SRPMS
enabled=0
gpgcheck=1
gpgkey=https://download.ceph.com/keys/release.asc
type=rpm-md
[tcmu-runner]
name=tcmu-runner
baseurl=https://3.chacra.ceph.com/r/tcmu-runner/master/eef511565078fb4e2ed52caaff16e6c7e75ed6c3/centos/7/flavors/default/x86_64/
priority=1
gpgcheck=0
[ceph-iscsi-conf]
name=ceph-iscsi-config
baseurl=https://3.chacra.ceph.com/r/ceph-iscsi-config/master/7496f1bc418137230d8d45b19c47eab3165c756a/centos/7/flavors/default/noarch/
priority=1
gpgcheck=0
温馨提醒
tcmu软件包没有包括在常用的第三方的yum源中,只有redhat官方的源,但没有订阅的话不能使用,所以有个人用户搞了tcmu-runner 源,但个人源不能保证一直有效。
在每个iSCSI网关节点上安装ceph-iscsi-tools软件包,安装ceph-iscsi会自动安装tcmu-runner 包。
#yum install ceph-iscsi -y重启tcmu-runner。
#systemctl start tcmu-runner.service
#systemctl status tcmu-runner.service
#systemctl enable tcmu-runner.service
创建image pool。
#ceph osd pool create iscsi-images 32 32 replicated
#ceph osd pool application enable iscsi-images rbd
创建image。
#rbd --pool iscsi-images create --size=2048 'iscsi-gateway-image001'查看pool中的image。
#rbd ls -p iscsi-images
iscsi-gateway-image001
配置每一个iscsi gw节点上iscsi gateway配置文件,cluster_client_name为client.admin用户,trusted_ip_list 为所有iscsi gateway IP地址,api端口为5000,user为admin。
#vi /etc/ceph/iscsi-gateway.cfg
[config]
cluster_client_name = client.admin
pool = iscsi-images
trusted_ip_list = 192.168.123.199,192.168.123.238,192.168.123.242
minimum_gateways = 1
fqdn_enabled=true
#Additional API configuration options are as follows, defaults shown.
api_port = 5000
api_user = admin
api_password = admin
api_secure = false
#Log level
logger_level = WARNING
Trusted_ip_list是每个iscsi网关上IP地址的列表,这些IP地址将用于管理操作,例如目标创建,lun导出等。
重启rbd-target服务并设置开机启动。
#systemctl start rbd-target-api.service
#systemctl status rbd-target-api.service
#systemctl enable rbd-target-api.service
查看网关服务状态。
#gwcli info
Warning: Could not load preferences file /root/.gwcli/prefs.bin.
HTTP mode          : http
Rest API port      : 5000
Local endpoint     : http://localhost:5000/api
Local Ceph Cluster : ceph
2ndary API IP's    : 192.168.123.199,192.168.123.238,192.168.123.242
iscsi-gateway命令行工具gwcli用于创建/配置iscsi-target与rbd image;其余较低级别命令行工具,如targetcli或rbd等,可用于查询配置,但不能用于修改gwcli所做的配置。
可以查看当前iscsi gateway配置,当然gwcli只是命令行工具,当我们配置了Dashboard集成iscsi后,就不一定要用这个命令行工具配置了,可以使用图形界面配置也是一样的。
Dashboard启用用iscsi。
要禁用API SSL验证。
#ceph dashboard set-iscsi-api-ssl-verification false使用以下命令定义可用的iSCSI网关,添加iscsi-gateway之前,需要在每一个网关上启动rbd-api服务。
#ceph dashboard iscsi-gateway-add http://admin:admin@192.168.123.199:5000
#ceph dashboard iscsi-gateway-add http://admin:admin@192.168.123.238:5000
#ceph dashboard iscsi-gateway-add http://admin:admin@192.168.123.242:5000
温馨提醒
在本文的开始,说明了各节点的hosts配置文件中一定要是FQDN,就是因为添加每一台节点是默认都解析成了localhost.localdomain,所以会导致只能添加成功一个iscsi gateway节点(原因是默认只有127.0.0.1配置FQDN)。
添加iscsi gw网关的用户名admin,密码admin是根据iscsi gw配置文件中定义的api_user以及api_password。
查看配置。
#ceph dashboard iscsi-gateway-list
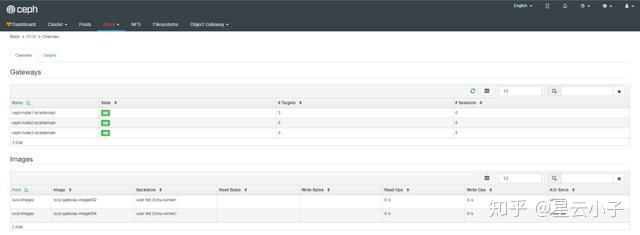
{"gateways": {"ceph-node2.localdomain": {"service_url": "http://admin:admin@192.168.123.238:5000"}, "ceph-node3.localdomain": {"service_url": "http://admin:admin@192.168.123.242:5000"}, "ceph-node1.localdomain": {"service_url": "http://admin:admin@192.168.123.199:5000"}}}登录Dashboard确认网关节点正常。

6.11 配置RBD Mirorr
Ceph Dashboard中界面中默认启用了rbd mirror的配置界面,但没有安装rbd mirror服务,需要手工安装下,当然这个配置使用就属于后话了,有机会在下一篇文章中写怎么配置使用rbd mirror。
#yum install rbd-mirror
#systemctl enable ceph-rbd-mirror.target
#systemctl start ceph-rbd-mirror.target
6.12 配置grafana
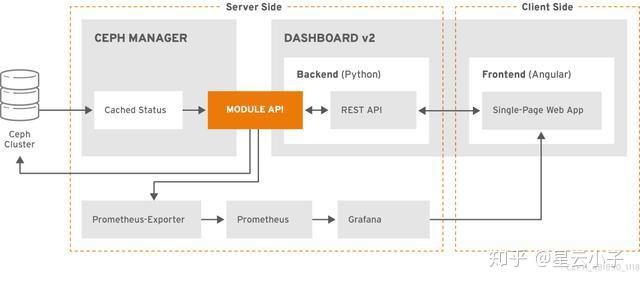
Ceph Dashboard中集成了grafana&prometheus,但需要手工启用,熟悉prometheus的人都知道其监控需要有exporter,ceph mgr模块中内置了prometheus exporter模块,所以无需要手工单独安装exporter,由于Ceph Dashboard中grafana还监控了Ceph存储节点的监控信息,所以每台存储节点中需要安装prometheus node exporter,借用redhat官方文档说明下这个架构:

在grafana节点上配置grafana yum源。
#vi /etc/yum.repos.d/grafana.repo
[grafana]
name=grafana
baseurl=https://mirrors.cloud.tencent.com/grafana/yum/el7/
enabled=1
gpgcheck=0
通过yum命令安装grafana。
#yum -y install grafana -y在/etc/grafana/grafana.ini中配置Grafana 以适应匿名模式,并修改grafana默认风格,否者默认为暗黑,集成到ceph dashboard中风格不匹配。
#vi /etc/grafana/grafana.ini
default_theme = light
[auth.anonymous]
enabled = true
org_name = Main Org.
org_role = Viewer
温馨提醒
注意Main Org后面的个点“.”不要忘记!
在较新版本的Grafana(从6.2.0-beta1开始)中,`allow_embedding`引入了一个名为的新设置 。该设置需要明确设置`true`,Ceph Dashboard中的Grafana集成才能正常使用,因为其默认值为`false`。
启动grafana并设为开机自启。
#systemctl start grafana-server.service
#systemctl status grafana-server.service
#systemctl enable grafana-server.service
安装grafana插件。
#grafana-cli plugins install vonage-status-panel
#grafana-cli plugins install grafana-piechart-panel
重启grafana服务。
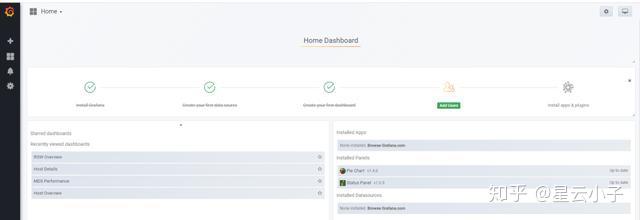
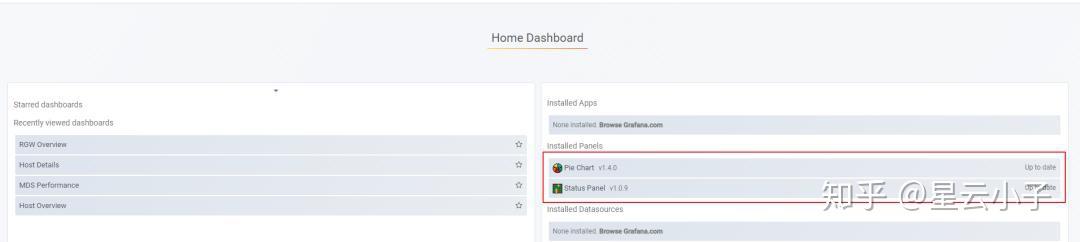
#systemctl restart grafana-server打开浏览器输入grafana地址。http://192.168.123.240:3000,输入默认用户名admin,默认密码admin,打开grafana界面:

查看已安装的插件。

6.12 安装prometheus
安装prometheus。
从官方下载prometheus软件包并解压。
#tar prometheus-2.14.0.linux-amd64.tar.gz复制到目录中
#mkdir /etc/prometheus
#mv prometheus-2.13.1.linux-amd64/* /etc/prometheus
查看prometheus版本。
#./prometheus --version配置系统服务启动。
#vi /etc/systemd/system/prometheus.service
[Unit]
Description=Prometheus Monitoring System
Documentation=Prometheus Monitoring System
[Service]
ExecStart=/etc/prometheus/prometheus \
  --config.file /etc/prometheus/prometheus.yml \
  --web.listen-address=:9090
[Install]
WantedBy=multi-user.target
修改默认配置文件。
#vi /etc/prometheus/prometheus.yml
 scrape_interval: 5s
scrape_configs:
  # The job name is added as a label `job=<job_name>` to any timeseries scraped from this config.
    # metrics_path defaults to '/metrics'
    # scheme defaults to 'http'.
  - job_name: 'prometheus'
    static_configs:
      - targets: ['192.168.123.240:9090']
  - job_name: 'ceph'
    honor_labels: true
    static_configs:
      - targets: ['ceph-node1.localdomain:9283']
        labels:
          instance: 'ceph_cluster'
      - targets: ['ceph-node2.localdomain:9283']
        labels:
          instance: 'ceph_cluster'
      - targets: ['ceph-node3.localdomain:9283']
        labels:
          instance: 'ceph_cluster'
  - job_name: 'node-exporter'
    static_configs:
      - targets: ['ceph-node1.localdomain:9100']
      - targets: ['ceph-node2.localdomain:9100']
      - targets: ['ceph-node3.localdomain:9100']
温馨提醒
以上配置文件targetes需要写成域名,否者ceph dashboard 中host details 中不能正常显示监控数据,而grafana中显示正常,grafana使用IP查询正常,ceph dashboard因为他是使用的域名查询监控信息,而prometheus中写的是IP,导致查询不到,所以这里要写成域名。
honor_labels参数 必须有并设置为true,否者会导致Ceph Dashbaord中显示grafana 某些面板没有数据出现。
加载系统服务。
#systemctl daemon-reload启动服务和添加开机自启动。
#systemctl start prometheus
#systemctl status prometheus
#systemctl enable prometheus
安装prometheus node_exporter
从官方下载node_export软件包到每一台存储节点上,并解压。
#tar -zxvf node_exporter-0.18.1.linux-amd64.tar.gz 复制到目录。
#mkdir /etc/node_exporter
#cp node_exporter-0.18.1.linux-amd64/* /etc/node_exporter/
配置成系统服务启动。
#vi /etc/systemd/system/node_exporter.service
[Unit]
Description=Prometheus node_exporter
[Service]
User=nobody
ExecStart=/etc/node_exporter/node_exporter --log.level=error
ExecStop=/usr/bin/killall node_exporter
启动服务。
#systemctl daemon-reload
#systemctl enable node_exporter.service
#systemctl start  node_exporter.service
#systemctl status  node_exporter.service
查看监控端口。
#ss -tunpl |grep 9100
tcp    LISTEN     0      128      :::9100                 :::*                   users:(("node_exporter",pid=6776,fd=3))
6.13 启用Ceph exporter
通过运行以下命令启用作为Ceph Manager模块附带的Ceph Exporter。
#ceph mgr module enable prometheus查看启用的prometheus模块。
#ceph mgr services
{
    "dashboard": "http://ceph-node1.localdomain:8443/",
    "prometheus": "http://ceph-node1.localdomain:9283/"
}
确认端口正在监控,正常情况只要开户prometheus,每一台存储节点上都会开启9283端口。
#ss -tunpl |grep 9283
tcp LISTEN 0 5 :::9283 :::* users:(("ceph-mgr",pid=1071,fd=22))输入http://192.168.123.240:9090,打开prometheus target界面确认ceph mgr、node export、prometheus都正常。
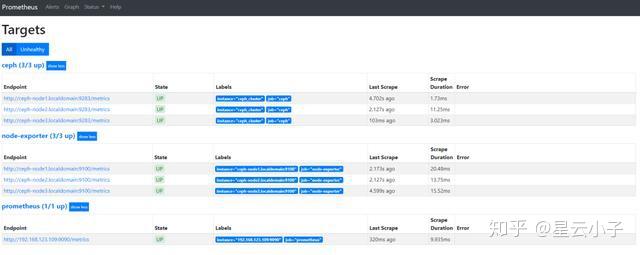

想要ceph三个节点都显示"UP",必须在所有的Ceph节点中都启用MGR,否者只有一个是"UP"。
配置禁用SSL。
# ceph dashboard set-grafana-api-ssl-verify False设置grafana的地址。
#ceph dashboard set-grafana-api-url http://192.168.123.240:3000温馨提醒
此处的grafana地址不能为域名,必须为IP。
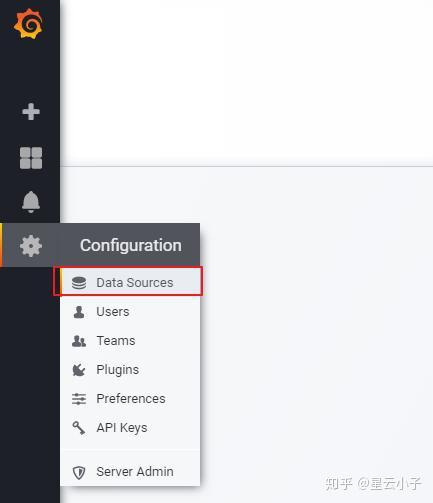
6.14 配置grafana对接prometheus
打开grafana界面,点击“配置”中的数据源。

点击“增加数据源”。
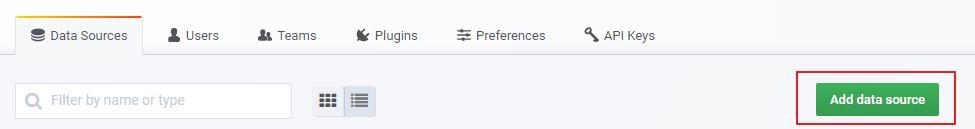

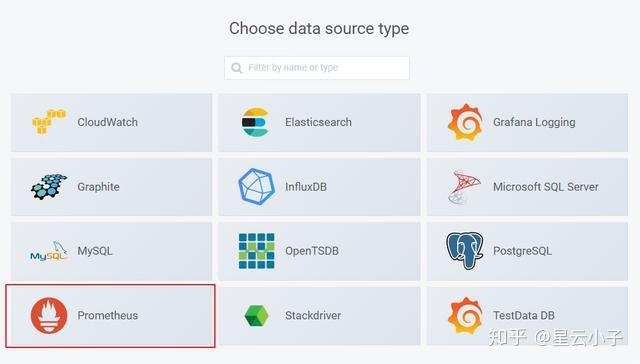
选择prometheus。

输入名称以及IP。

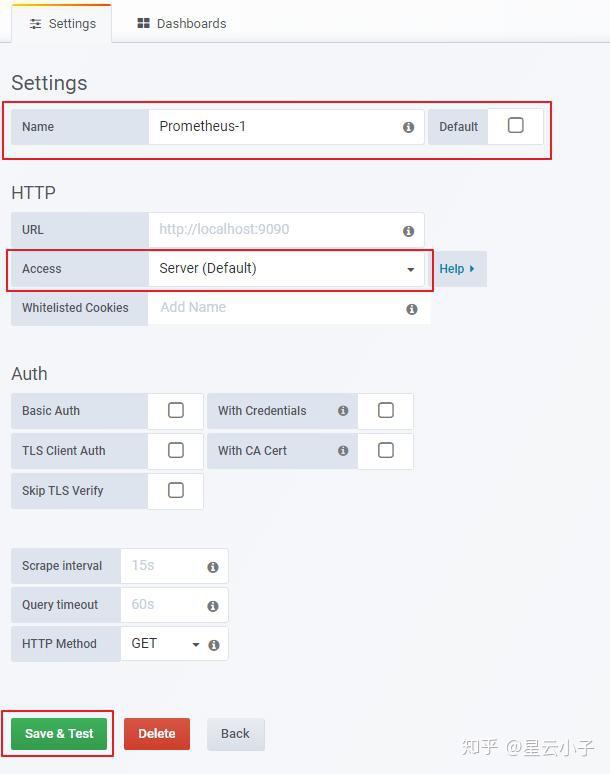
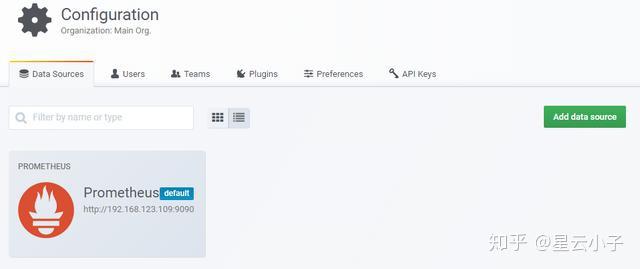
完成配置。

6.15 配置grafana模板
导入ceph dashboard grafana插件,有两种方式可以导入dashboard,一是github地址直接下载并导入,二是本地导入,其实在安装Dashboard的时候就会自动安装ceph dashboard grafana插件了。
github地址如下:
https://github.com/ceph/ceph/tree/master/monitoring/grafana/dashboards。
通过命令查看目录位置。
#rpm -qa |grep dashboard
ceph-grafana-dashboards-14.2.8-0.el7.noarch
ceph-mgr-dashboard-14.2.8-0.el7.noarch
#rpm -ql ceph-grafana-dashboards-14.2.8-0.el7.noarch
/etc/grafana/dashboards/ceph-dashboard
/etc/grafana/dashboards/ceph-dashboard/ceph-cluster.json
/etc/grafana/dashboards/ceph-dashboard/cephfs-overview.json
/etc/grafana/dashboards/ceph-dashboard/host-details.json
/etc/grafana/dashboards/ceph-dashboard/hosts-overview.json
/etc/grafana/dashboards/ceph-dashboard/osd-device-details.json
/etc/grafana/dashboards/ceph-dashboard/osds-overview.json
/etc/grafana/dashboards/ceph-dashboard/pool-detail.json
/etc/grafana/dashboards/ceph-dashboard/pool-overview.json
/etc/grafana/dashboards/ceph-dashboard/radosgw-detail.json
/etc/grafana/dashboards/ceph-dashboard/radosgw-overview.json
/etc/grafana/dashboards/ceph-dashboard/rbd-overview.json
/usr/share/doc/ceph-grafana-dashboards-14.2.8
/usr/share/doc/ceph-grafana-dashboards-14.2.8/README
/usr/share/doc/ceph-grafana-dashboards-14.2.8/README.md
打开grafana选择“导入”。
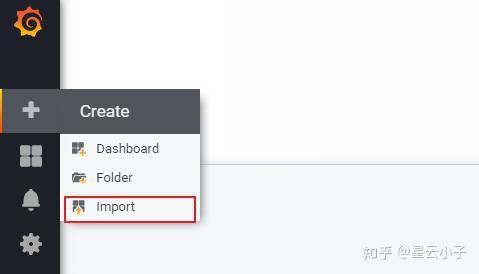

打开导入面板,选择"导入"。
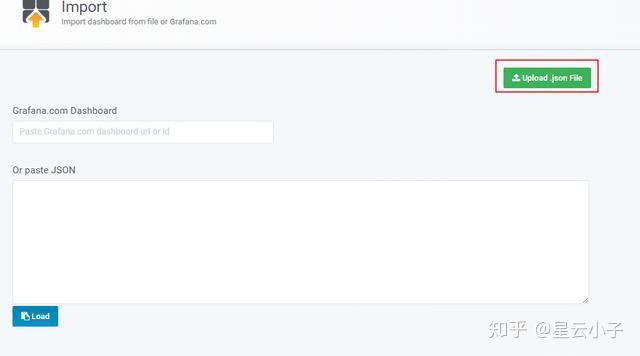

导入所有的Dashboard模板文件,查看导入的模板文件。
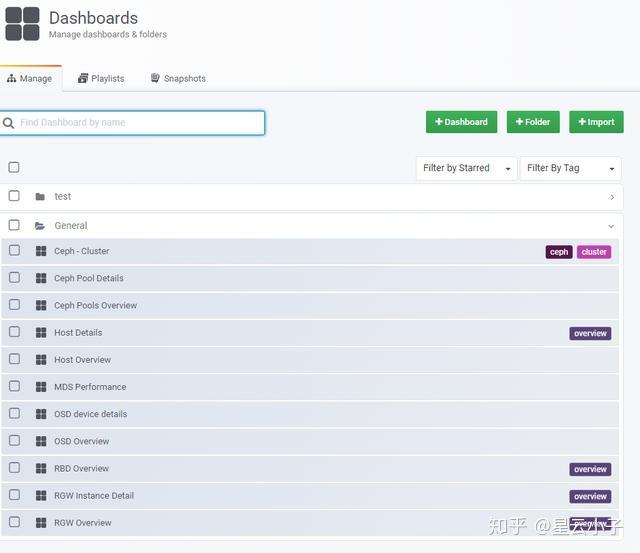

查看导入模板的详细信息。
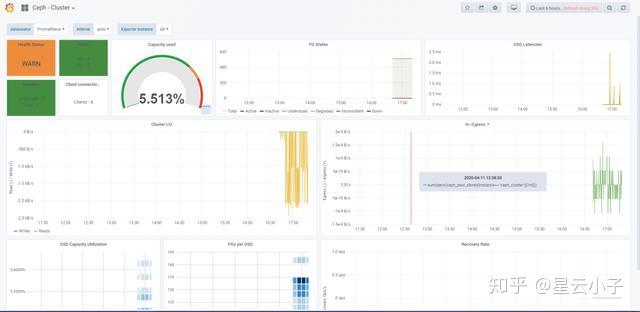

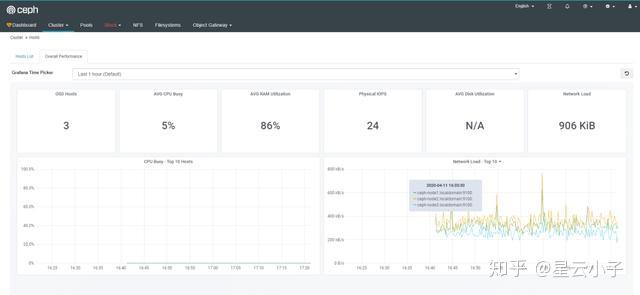
打开Ceph Dashboard查看其内嵌有的Dashboard。

结尾
在此文编写过程中Ceph社区发了布了最新的Ceph Octopus版本,这个版本中最大的变化是使用了容器安装Ceph,只需要几条命令就能安装出一个带Dashboard的Ceph集群,也就无需像本文中这么折腾安装了。
新版本抛弃了Ceph-Deploy工具,只能使用Cephadm工具安装,而新的安装方式中Dashboard是默认启用的,也能看出未来Dashbaord在Ceph中的地位,不是像以前是可选的了,由于是新出的Cephadm,所以还有些功能是未开发完成的,比如无法安装iscsi等。
简单说几点新版本Ceph的改进:
1.Dashboard界面变成了多数WEB使用的侧边导航栏结构。

2.增加了监控功能,使用的是prometheus alert模块实现。
其它可参考官方release说明: