
An Analysis of Ted Talks through Data Mining

Group project
by ZHOU Yansong, XIAO Jiasheng, LI Jingxuan
TED (Technology, Entertainment, Design), conceived by Richard Saulman in 1984, is an American media organization that posts talks online for free distribution under the slogan “ideas worth spreading”. At the beginning, the organization focused on technology and design only, then it has broadened its perspectives to include talks on many scientific, cultural, political, and academic topics. Every year, from February to March, TED Conference will invite experts from all over North America to present their ideas on a wide arrange of topics within their research and practice of science and culture, and then the videos of the speeches will be uploaded to http://ted.com for free viewing. So far (up to Dec. 15, 2019), the number of videos on http://ted.com has reached to 3483, and they have been viewed billions of times.
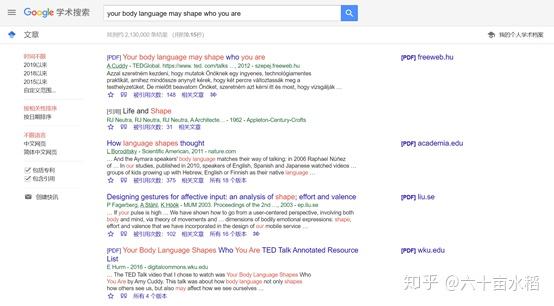
With a shocking amount of distribution online and great popularity, those “world changing ideas” TED is promoting are having a global impact, and in China, lots of teachers and students have embraced TED talks as a learning platform. When I was in high school, our English teacher introduced TED talks to us as English learning material. In college, Ted talks were recommended as a global classroom where we can explore some of very best minds from all walks and cutting-edge knowledge. The videos offer us some research inspiration too. A quick Google Scholar search shows TED talks even received scholarly citations. The successful dissemination of TED concept in China arouses our curiosity and we want to analyze the videos on http://ted.com to get a better understanding of its big picture and what features those popular talks have in common.

Crawling
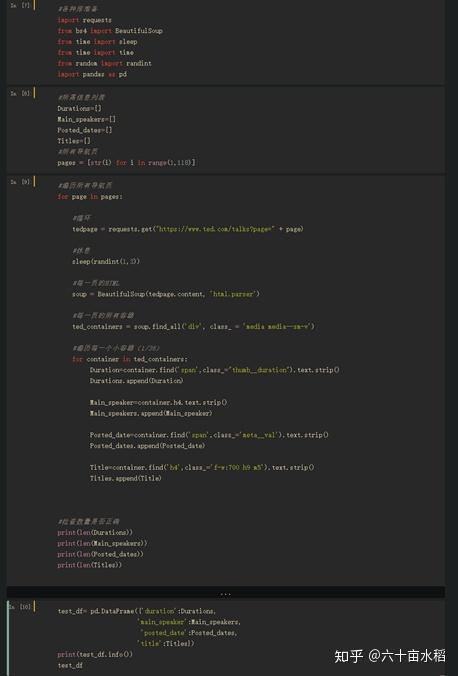
http://Ted.com currently has more than 3,200 videos available for viewing. After analyzing the structure of the website, we use the navigation page as the minimum crawling page in order to reduce the resource occupation and running time of the crawler. Considering that each navigation page contains the basic information of 36 videos, including video duration, video title, Speaker’s name, views, posted time, crawler only need to loop 118 times in total to crawl the above information of all videos.
We had to sperate the crawling process into two parts because views and posted dates are not presented on the same page. Therefore, we first crawled the pages sorted by posted dates and we got durations, main speakers, posted dates, and titles; and then we crawled the pages sorted by most viewed, and we got durations, main speakers, views, and titles.
These are the crawler programs we wrote:


Here are the results of two parts:
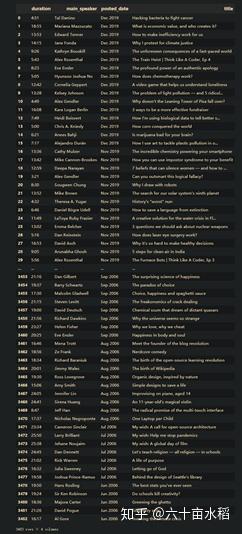
The crawling processes took about five minutes and after that, we got titles, main speakers, durations, views and posted dates of all talks on the site. We exported the results in Excel file format.
Cleaning
All information was extracted in text, but several types of information, such as duration, page views, could not be processed unless they were converted into time and numbers in subsequent analysis. Therefore, we used formatting cells and replace in Excel and created a function to convert variable views and durations into appropriate format, making it easier for further processing.
Analyzing
We used SPSS and Excel to analyze the datasets and visualize the results:
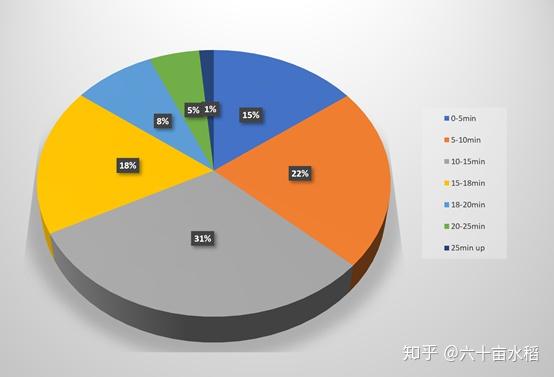
1.Talks' durations are between 1 minute (Ode to the Only Black Kid in the Class by Clint Smith, Sep 2019) and 1 hour and 27 minutes (Parrots, the universe and everything by Douglas Adams, Mar 2010). Although speakers are given a maximum of 18 minutes to present their ideas, 14% of the talks last for more than 18 minutes. Those talks within 20 minutes account for 94% of the total.

From 2006 to 2019, the average durations have been on a downward trend.


2. The number of video views are between 10K (A 13-year-old’s Plan for Removing Plastic from Oceans by Haaziq Kazi, Sep 2019) and 63M (Do Schools Kill Creativity? by Sir Ken Robinson, Jun 2006) and the average is 2.07M.


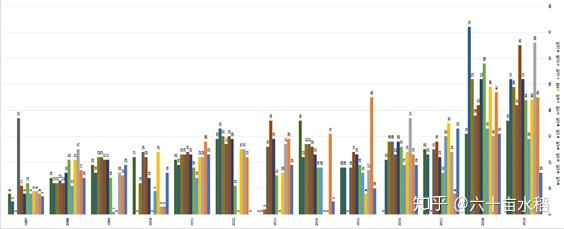
3. The total number of videos released by TED’s official website from 2006 to 2019 was 3483. 540 videos have been released so far (Dec.15) in 2019, and 2019 is the year with the largest number of videos. In 2006 when talks were uploaded online for the first time, 49 videos were released, which is the year with the least number of videos. From 2006 to 2019, the number of videos has been on the rise overall.


4. From 2007 to 2019 (TED started to publish videos online from June 2006, so we exclude the data of 2006), the number of videos released in August each year is the largest, with an annual average of 28; the number of videos released in May each year is the smallest, with an annual average of 14.46.

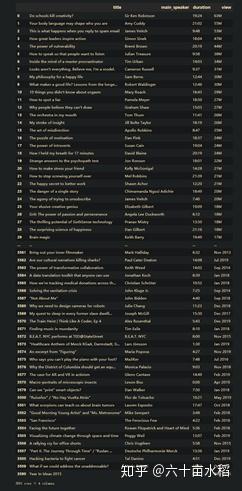
Top 10 most viewed TED talks of all times
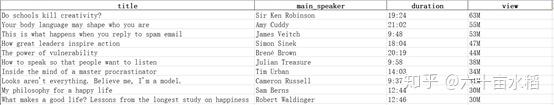

- Sir Ken Robinson's speech Do schools kill creativity? is the most popular of all time, with 63M views, and a duration of 19 minutes and 24 seconds, slightly exceeding the upper time limit (18 min).
- Amy Cuddy's speech Your body language may shape who you are is the second most popular video, with 55M views and 21 minutes and 2 seconds in duration.
- All top 10 most viewed talks are viewed more than 30M times. All the top 3 videos' views exceeds 50M. Both the fourth and the fifth one exceeds 40M.
- Among the tags of the top 10 most viewed Ted talks, Tedx and Culture appear most often, and four talks are tagged with them. A TEDx event is a local gathering where live TED-like talks and performances are shared with the community. The tag Tedx presents in nearly half of the top 10 talks, indicating that Tedx has become an excellent channel for producing speech content. The presence of more Culture tag indicates that popular ted talks tend to involve cultural issues, such as Do Schools Kill Creativity?, focusing on creating an education system that nurtures creativity.
Top 10 most viewed TED talks in 2019 (Up to Dec 15, 2019)
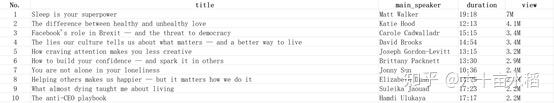

- Matt Walker's speech, Sleep is Your Superpower, is the most popular talk in 2019, with 7M views and a duration of 19 minutes and 18 seconds, which also slightly exceeds the upper time limit (18 min).
- Katie Hood's talk The difference between healthy and unhealthy love is the second most popular one in 2019, with 4.1M views and a duration of 12 minutes and 13 seconds.
- All top 10 most viewed talks are viewed more than 2M times. Both the top 2 talks' views exceed 4M, which is far less than its counterpart of all times (118M). Both the third and the fourth one has received more than 3M views.
- Among tags of the top ten most viewed Ted talks in 2019, tag Personal Growth and Society appear most frequently. Both of them appearing five times, and the talks with these tags account for 50% of the total number.
Conclusion
- According to analysis, Ted talks within 20 minutes account for 94% of the total and those within 15 minutes account for 68%. TED requires its speakers to present their ideas with a maximum of 18 minutes. Given such short time, speakers may have to figure out a way to catch audience's eyes as soon as possible, which may encourage them to give a presentation in the most innovative and engaging ways they can. And short videos can better accommodate people's new learning style in the era of fragmented information.
- There appears to be a wide disparity in views between popular and unpopular Ted talks. The most popular talk has been played more than 63 million times while those paid little attention to may receive views less than 1 thousand. From 2006 to 2019, the number of talks released on the website every year has been increasing rapidly, from 49 to 540 (up to Dec 15, 2019). Productivity may be one factor responsible for the wide disparity in view figure.
- Generally, audience may be more interested in talks related to culture issue because content related to culture tends to be interesting and easy to understand, compared to technology topics, which may contain a lot of tedious terminology and numbers. However, in 2019, topics related to personal growth and society become more popular. People focus more on individual experience. And citizens may raise more concern about the escalating social situations worldwide.
Work Distribution
After deciding to analyze ted.com, we distributed the work as follow.
1. ZHOU Yansong (№55945742) and XIAO Jiasheng (№56068308) worked on the crawling code and dataset for further analysis.
2. LI Jingxuan (№55952002) was in charge of data analysis.
3. All group members worked together on the final report.